
Brought to you by... Rillion

CFOs are pushing AI adoption in finance but are their teams, processes, and systems actually ready to make it work?
Hear what 250 CFOs said about adopting AI in their departments in Rillion’s 2026 Finance AI Report webinar. See what’s working, where CFOs are finding the best AI use cases, and what still isn’t ready for prime time.
I asked Nate Nasralla, CEO of Fluint, to guest write about how AI has changed (or should be changing) GTM efficiency and how we evaluate sales reps. Nate has spent 20 years in sales and currently spends all of his time helping sales teams adopt and leverage AI. So he knows what he’s talking about…
His concept of “floating highways” is my new favorite analogy for how we should think about real AI adoption.
So, on to Nate’s post…
Floating Highways: How to Rethink GTM Efficiency & Rep Evaluation for the AI Era
I’ve been at 18 customer onsites since the start of the year, and there’s a simple analogy I’ve used at almost all of them to describe what AI x GTM is right now.
Remember The Flintstones? How Fred traveled around?
A pedal car, powered by his feet. Pure leg day, every day baby.
Now, remember The Jetsons? They had hovercars, a fundamentally different technology. But what’d they do with it? They “drove” down floating highways. With stoplights, cross traffic, and lanes. Taking tech that unlocked entirely new planes of travel, and bolted it onto what they already knew: roads.
Most GTM teams today are running on floating highways. Somewhere in-between the early 2020 motion, and, what’s to come.
You can run all the “AI Maturity Assessments” you’d like, but you really only need one question to know whether your org has been building a truly AI-native GTM:
If you killed all your AI contracts and ripped AI out of your GTM tomorrow, what would stop working?
Not “go slower,” or “be less convenient.”
What would break?
To the extent things break and just stop working, you’ve built an AI-native GTM. To the extent it keeps humming along, just slower: you’ve got a floating highway.
Now here’s why I think this question matters: the efficiency metrics you manage are built for one of these two worlds. So if your gauges are measuring the machine that no longer exists, or your GTM team is actively tearing down, then, you’re about to make headcount, comp, and budget decisions based on those readings.
So this write-up has three parts to help frame the shift you’re in the middle of today:
Part 1 is an audit. Which gauges on your dashboard were built for the old machine, vs. where GTM efficiency is actually found now?
Part 2 is about building the system. Breaking down “compound” metrics into the drivers you can influence, while modeling your GTM in a way that wasn’t possible before. (And if you do this, ripping AI out would break something, like a kill-switch.)
Part 3 is about people decisions. Headcount, comp, ramp, eval, etc. How to figure out if your reps are performing, and seeing the RevOps team building the systems behind them as someone who’s equally on the hook for a “quota” of sorts. Which flows downstream from the first two points.
(Part 1) What’s Changing?
Are you tracking MPG on an electric car?
I still drive my 2015 Audi Q5 because it’s a diesel, and gets 35 miles per gallon (better than my wife’s 21 MPG BMW). But, if I go to an Audi dealer and compare it to the e-tron, my Q5’s MPG is irrelevant. The e-tron’s an electric car, it’s an entirely different category.
Similarly, here’s a shortlist of metrics I’d be cautious of using in the coming year:
Pipeline Coverage: this used to be a proxy for “more pipeline = more revenue.” But generally, mid-funnel conversion rates are the same or declining year-over-year, with more of a buyer’s evaluation pushing further down the funnel, so early-stage pipeline coverage doesn’t carry the same weight.
Cost per Lead: I don’t know another operator who isn’t shifting their packaging and pricing. We’ve launched two new products in H1 at Fluint, each with a slightly different pricing model and GTM experience (PLG, self-serve with consumption bands for technical RevOps users, vs. core sales-led experience for non-technical buyers).
So my old measures of who a lead is, and my cost to “buy” one more, don’t work for AI-native customers coming in self-serve.Activity per Rep: this used to translate to pipeline. But now, activity is cheap and essentially infinite. So channels are saturated, and creating truly qualified opportunities is about a smaller set of targeted activities, born from a rep’s human judgment.
The common theme here is that sales efficiency is now found deeper in the mid-funnel:
AI is compressing the seller’s work (prep, follow-up, CRM fill, etc.), but, it largely hasn’t touched the buyer’s internal process after top-funnel research. A buyer still has to manage all the internal comms, stakeholder drama, and nuances of human approvals, to either expand a bottom-up experiment into an annual commit, or, for a customer to move to a new price and package.
As an example of this, let’s take a company that’s:
$100M ARR with three core segments.
Enterprise ($45M ARR, ~$250K ACV, with 20 AEs).
Mid-Market ($35M ARR, ~$60K ACV, 25 AEs).
SMB ($20M ARR, ~$12K ACV, 12 AEs).
We’ll call them “Bedrock” software. (My creation with illustrative numbers, but a composite of a few of our customers.) Their FY24-26 shows the evolution of (1) pre-AI, (2) the floating highway transition, and then, (3) refactoring for the AI era.
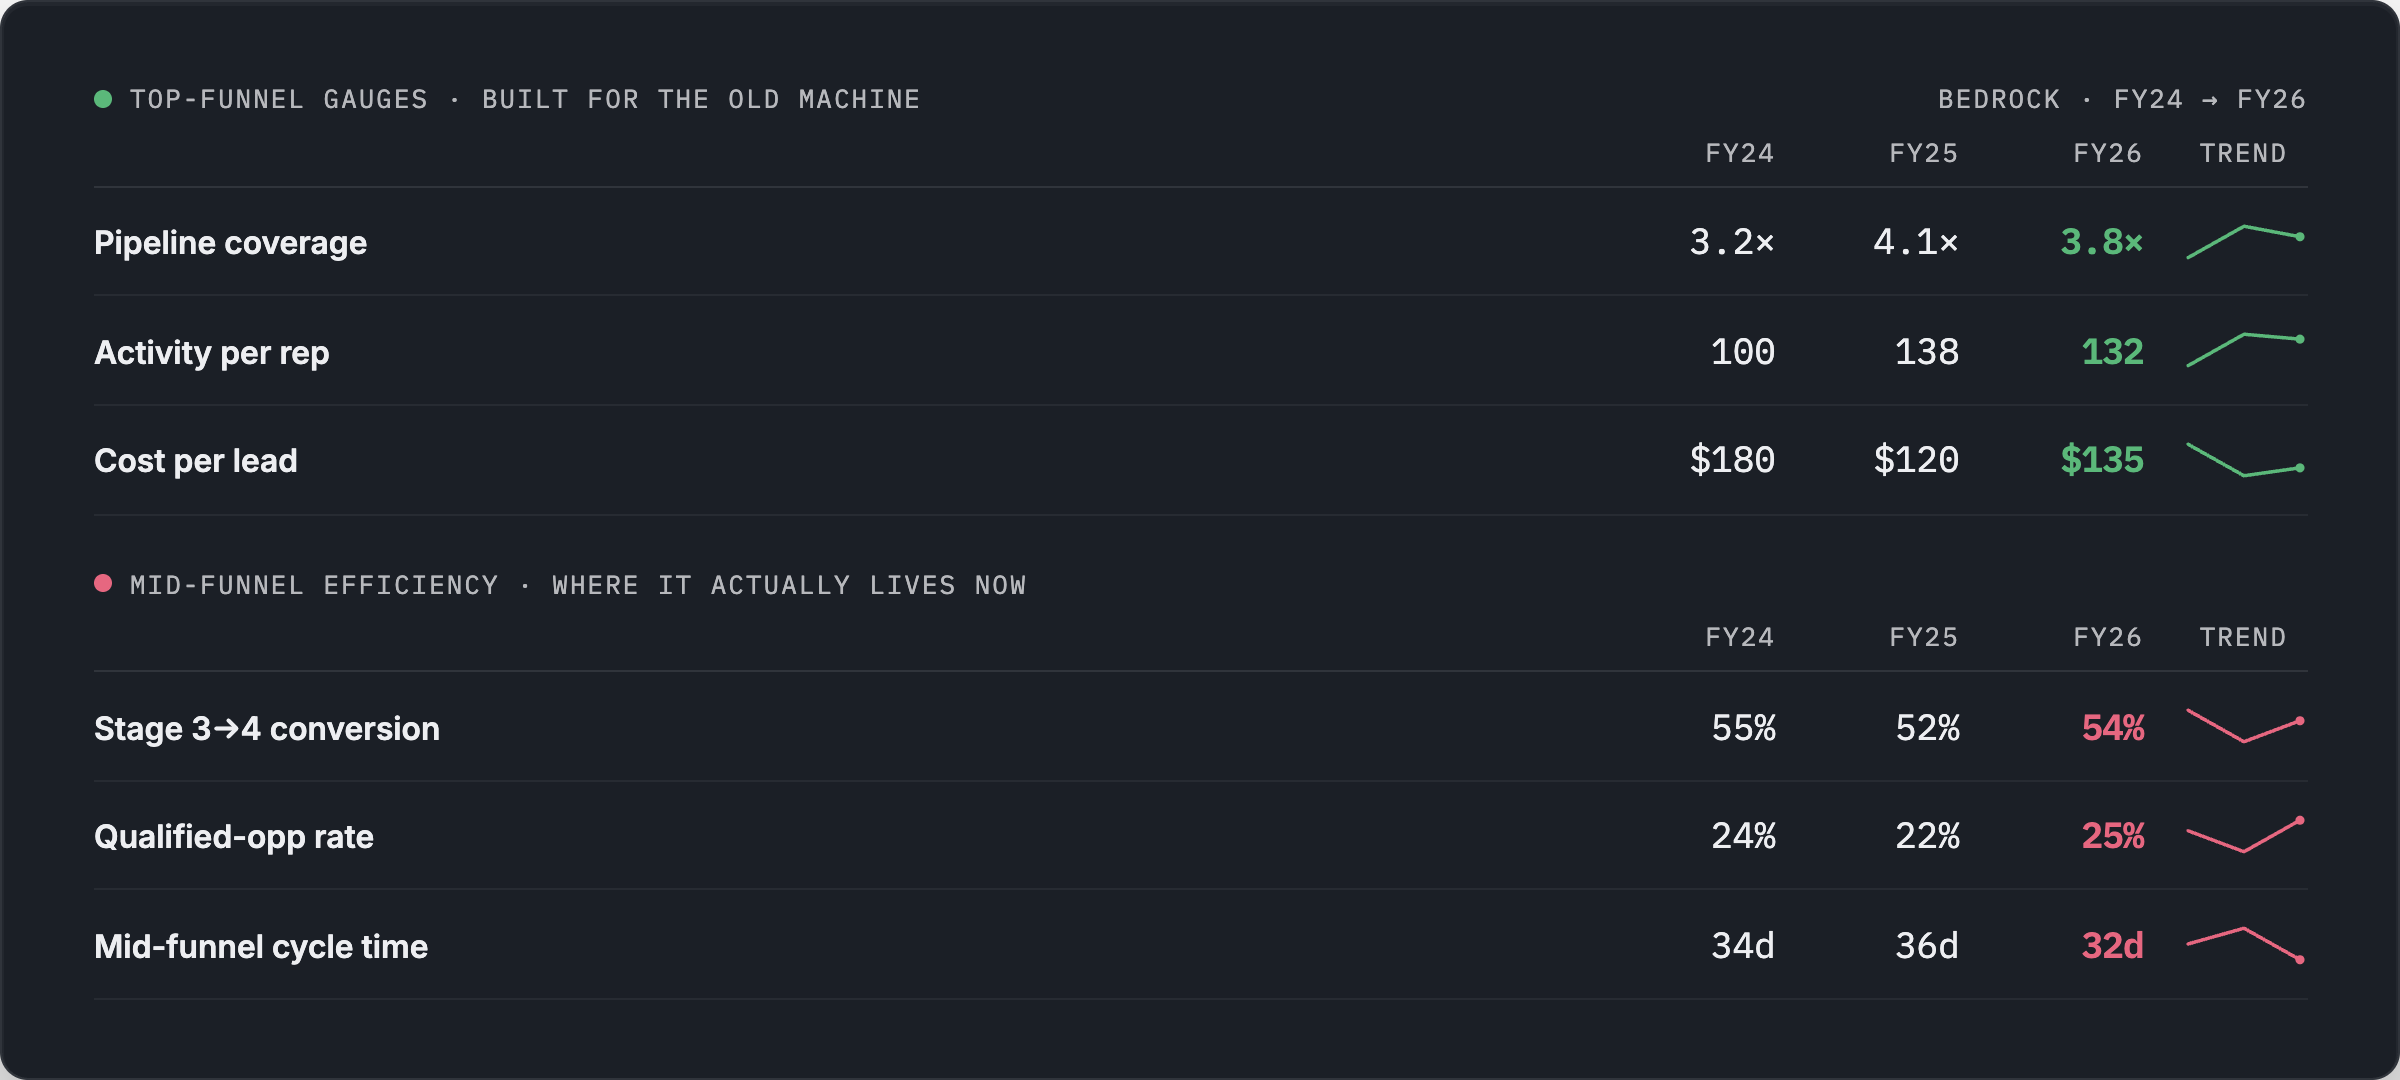
FY25 looks pretty good here when you focus on the top-funnel metrics, like lead generation and pipeline coverage. But those top-funnel gains don’t translate to a 1:1 revenue efficiency, if you follow the quality of the pipeline down through the middle and bottom-funnel, like Stage 3 conversion rates and sales cycle times.
Which is what their FY26 is correcting, with less focus on topline effort metrics (when effort was scarce and roughly equal to results). And more focus on mid-funnel efficiency, like stage-by-stage conversion.
Revenue comes from a mix of humans and agents, but agents don’t carry a quota.
In the past, you could use a simple Quota-Attained : OTE ratio to say, “2-3X is bad, 5-6X is good.” (OTE = on-target earnings, what you pay a rep in variable and base compensation).
This compares the human cost to carry out a set of sales actions, to the revenue they produced. But now, a growing share of the sales activity is agentic vs. humans alone:
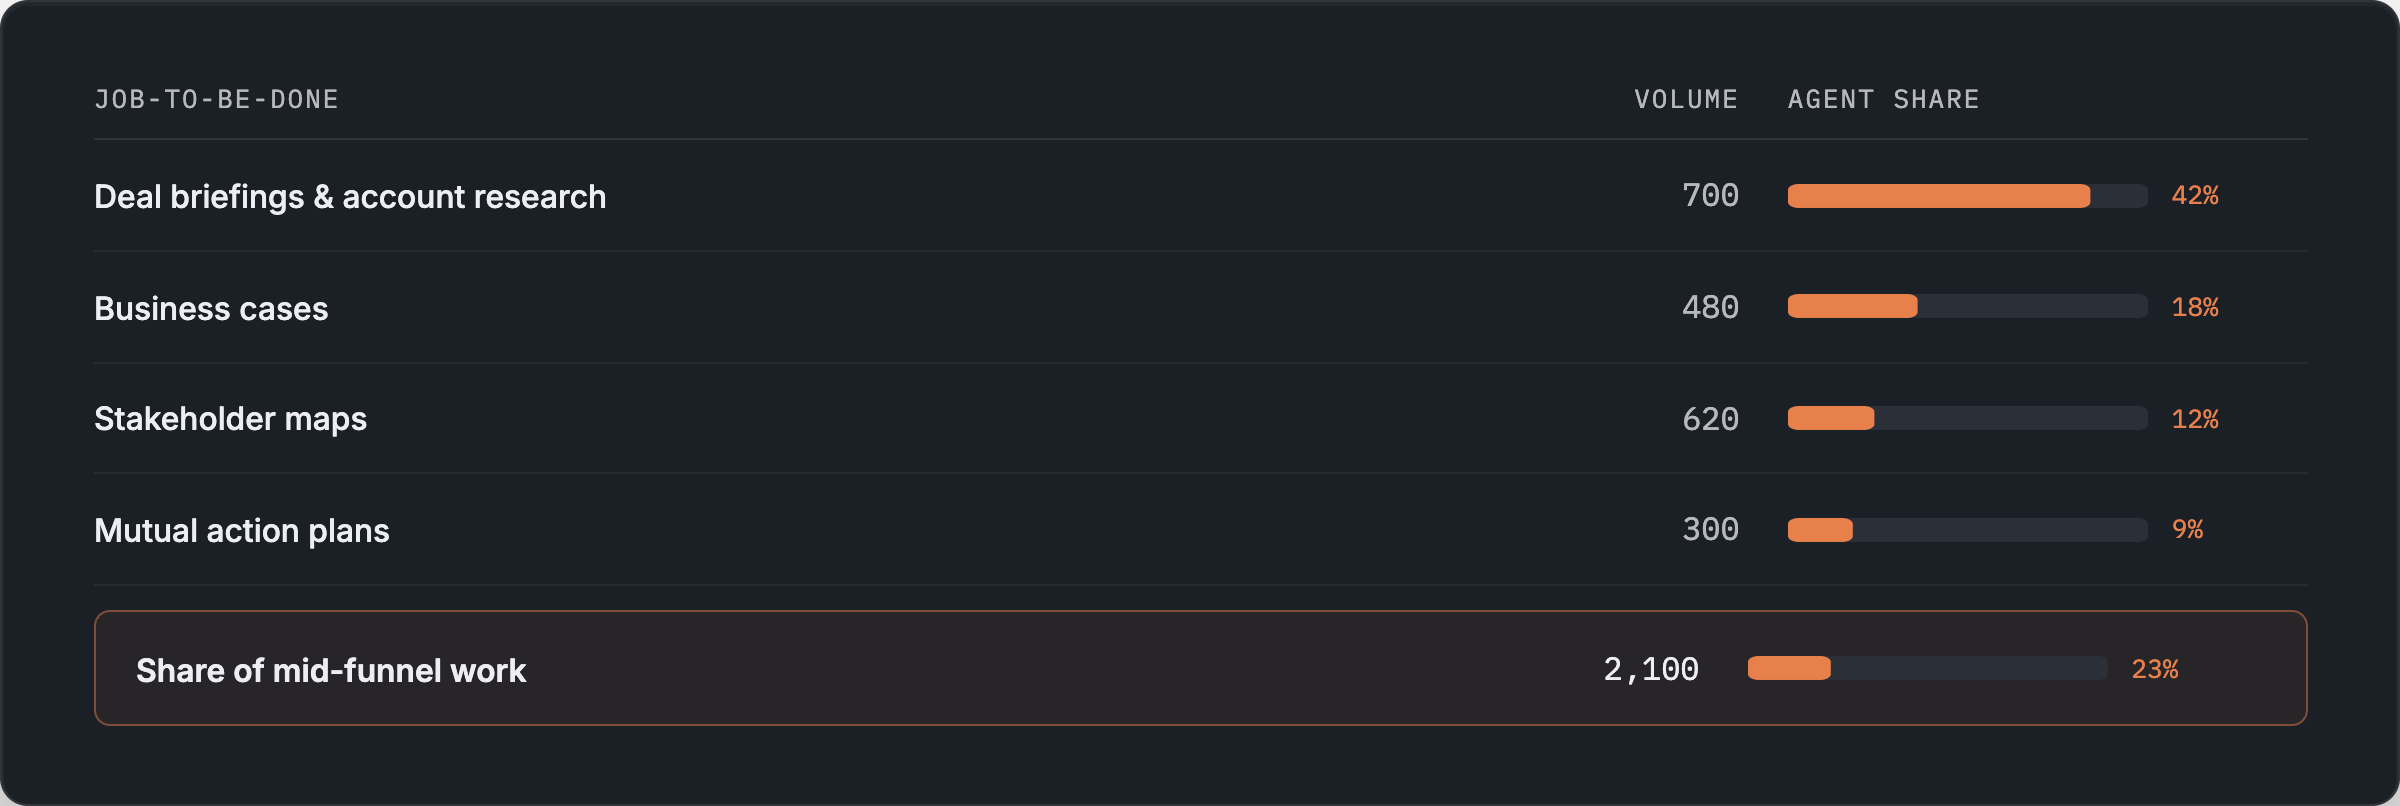
Which means every new dollar is increasingly system-enabled, not just sales-enabled. And the revenue generated by a system vs. sales carry different cost profiles. Now, follow me here:
You can split out the cost of each pretty quickly (token spend vs. payroll).
But it’s not so easy to attribute a percentage of a revenue outcome to an agent vs. a human rep. (The first half of the “Quota:OTE” ratio.)
So, if you’re spending on tokens to drive up the rep’s efficiency, and to take on a greater share of their work, shouldn’t their quota go up? But by how much?
And if you’re spending legit dollars on those agents’ tokens, don’t you need to know what the agents return? How well do they “attain” their “quota”?
The point we’re getting to here isn’t about capping AI spend (”tokenmaxxing” critiques have lost the plot). It’s more about the same question that marketing raised a decade ago. Attribution:
Which AI dollars trace to specific closed-won revenue, and which are just… waste?
This same concept around attribution needs to migrate further down the mid-funnel.
Where the next lift in efficiency is migrating (see point #1 above), and agent contribution and spend are growing the fastest. And once that “instrumentation” is in place, it’ll change the assumptions you use to drive capacity planning, compensation, and 2027+ budgets.
Which brings us to part 2, building the system, before we get to part 3, people decisions.
(Part 2) Building the System
Model your GTM:
Your FP&A team models the business with a “driver tree.” But GTM never got the same driver-based approach, because deals seem “non-deterministic.” Too many variables, and too much gut feel from sales leaders who need to sit on weekly forecast calls to divine whether Lakers season tickets are enough to swing Deal A our way.
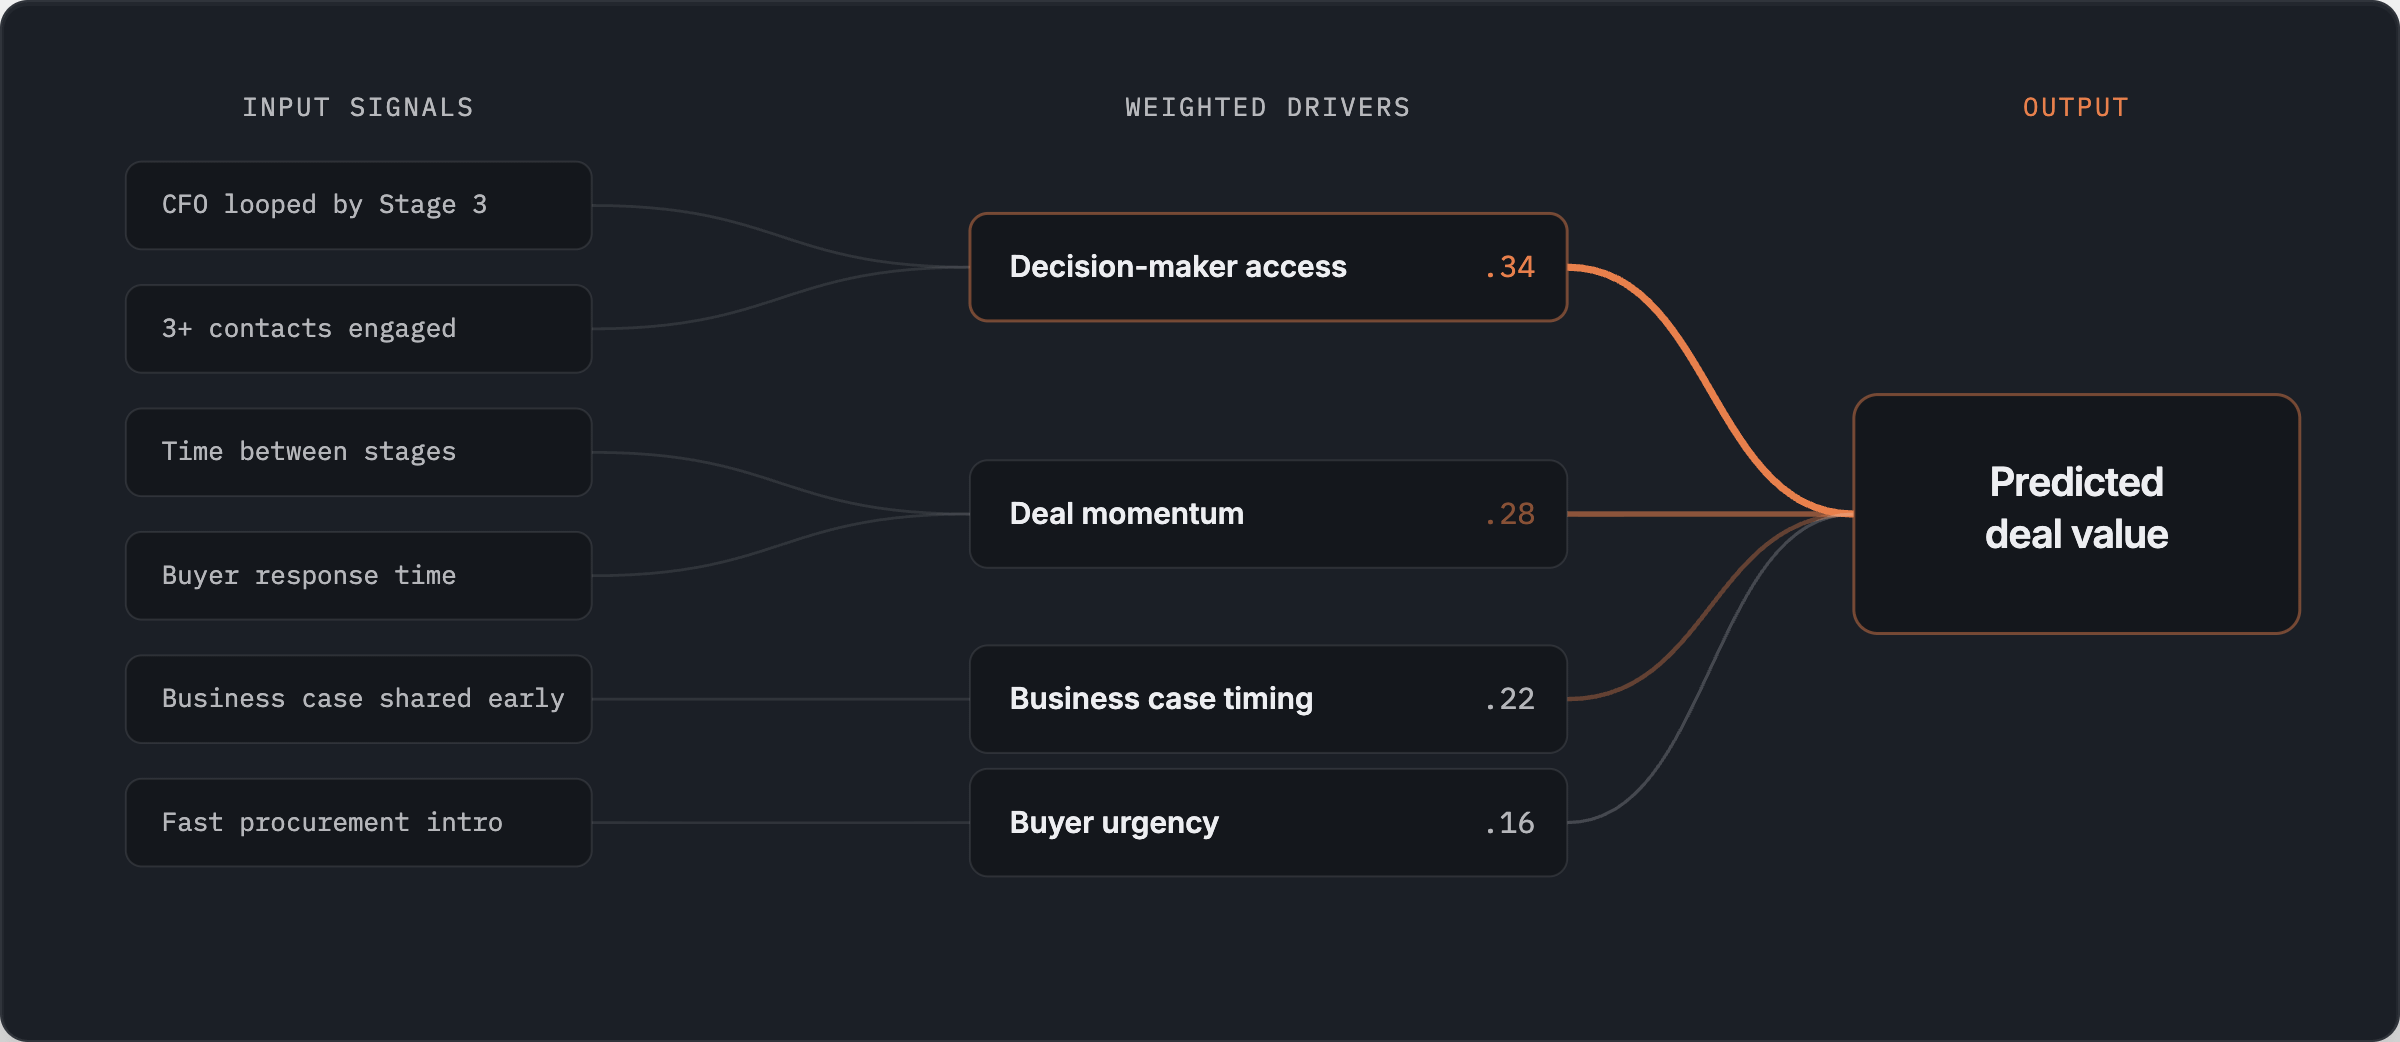
But now, you can use a lot of data to model the unique properties of your GTM: specific inputs (“behaviors”) that predict that deal, instead of relying on a general rule, “Stage 4 = 80% value.”
“You mean like having our team set up some Gong trackers or something?”
No, I mean a true model that can (1) weight dozens of sales behaviors, (2) retrains itself as your motion changes over time. Which is what you already do in FP&A, but for revenue.
Which you can do for revenue, in two ways:
Step one is what you feed the model: it’s about logging all the GTM activity data you have access to, joined to your revenue data.
Step two is what the model feeds you: thresholds that signal risk in the pipeline and base. Signals like, “Hey, deals in [ segment ] evaluating [ product X ] close 59% less often when [ title ] isn’t involved by [ stage 3 ].” So Finance doesn’t “peanut butter spread” the same probability across every deal in the same CRM stage.
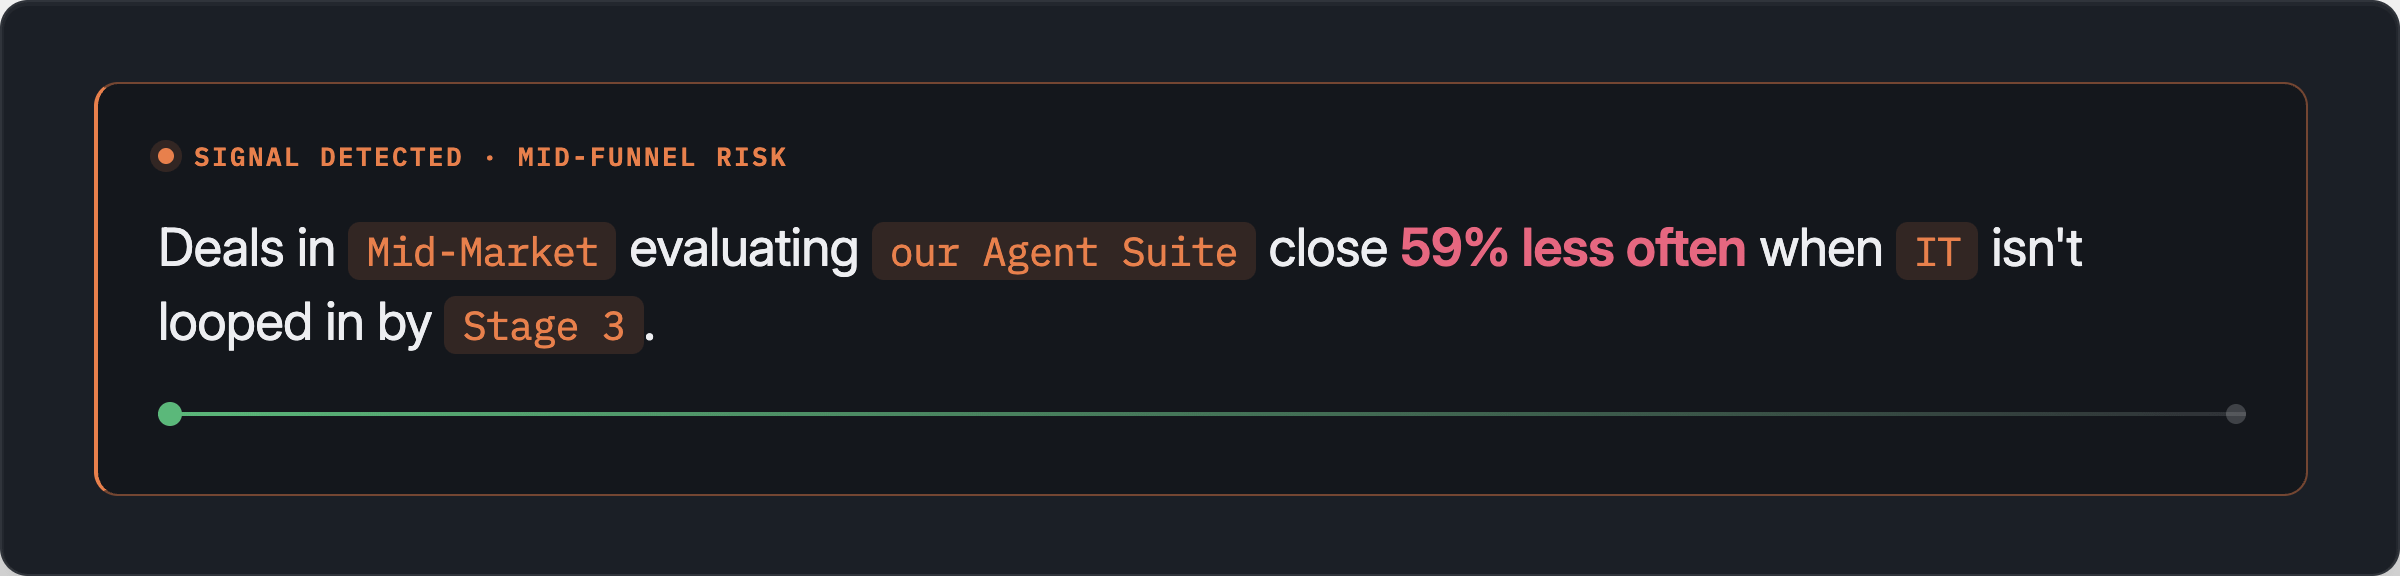
(This, by the way, is what I spend all day doing with customers at Fluint.)
Break out each segment independently.
I’m not telling you anything you don’t already know or do here. But before we get to part 3, we have to call out that AI delivers efficiency across Enterprise, Mid-market, and SMB segments differently. And we can’t tell an “AI efficiency story” in broad strokes.
For example, at a board-level, let’s say Bedrock’s LTV:CAC ratios looked good after the last year of AI rollouts. CAC drops from $47K to $36K in FY25, so we’d celebrate, “AI efficiency!”
But if we break it out:
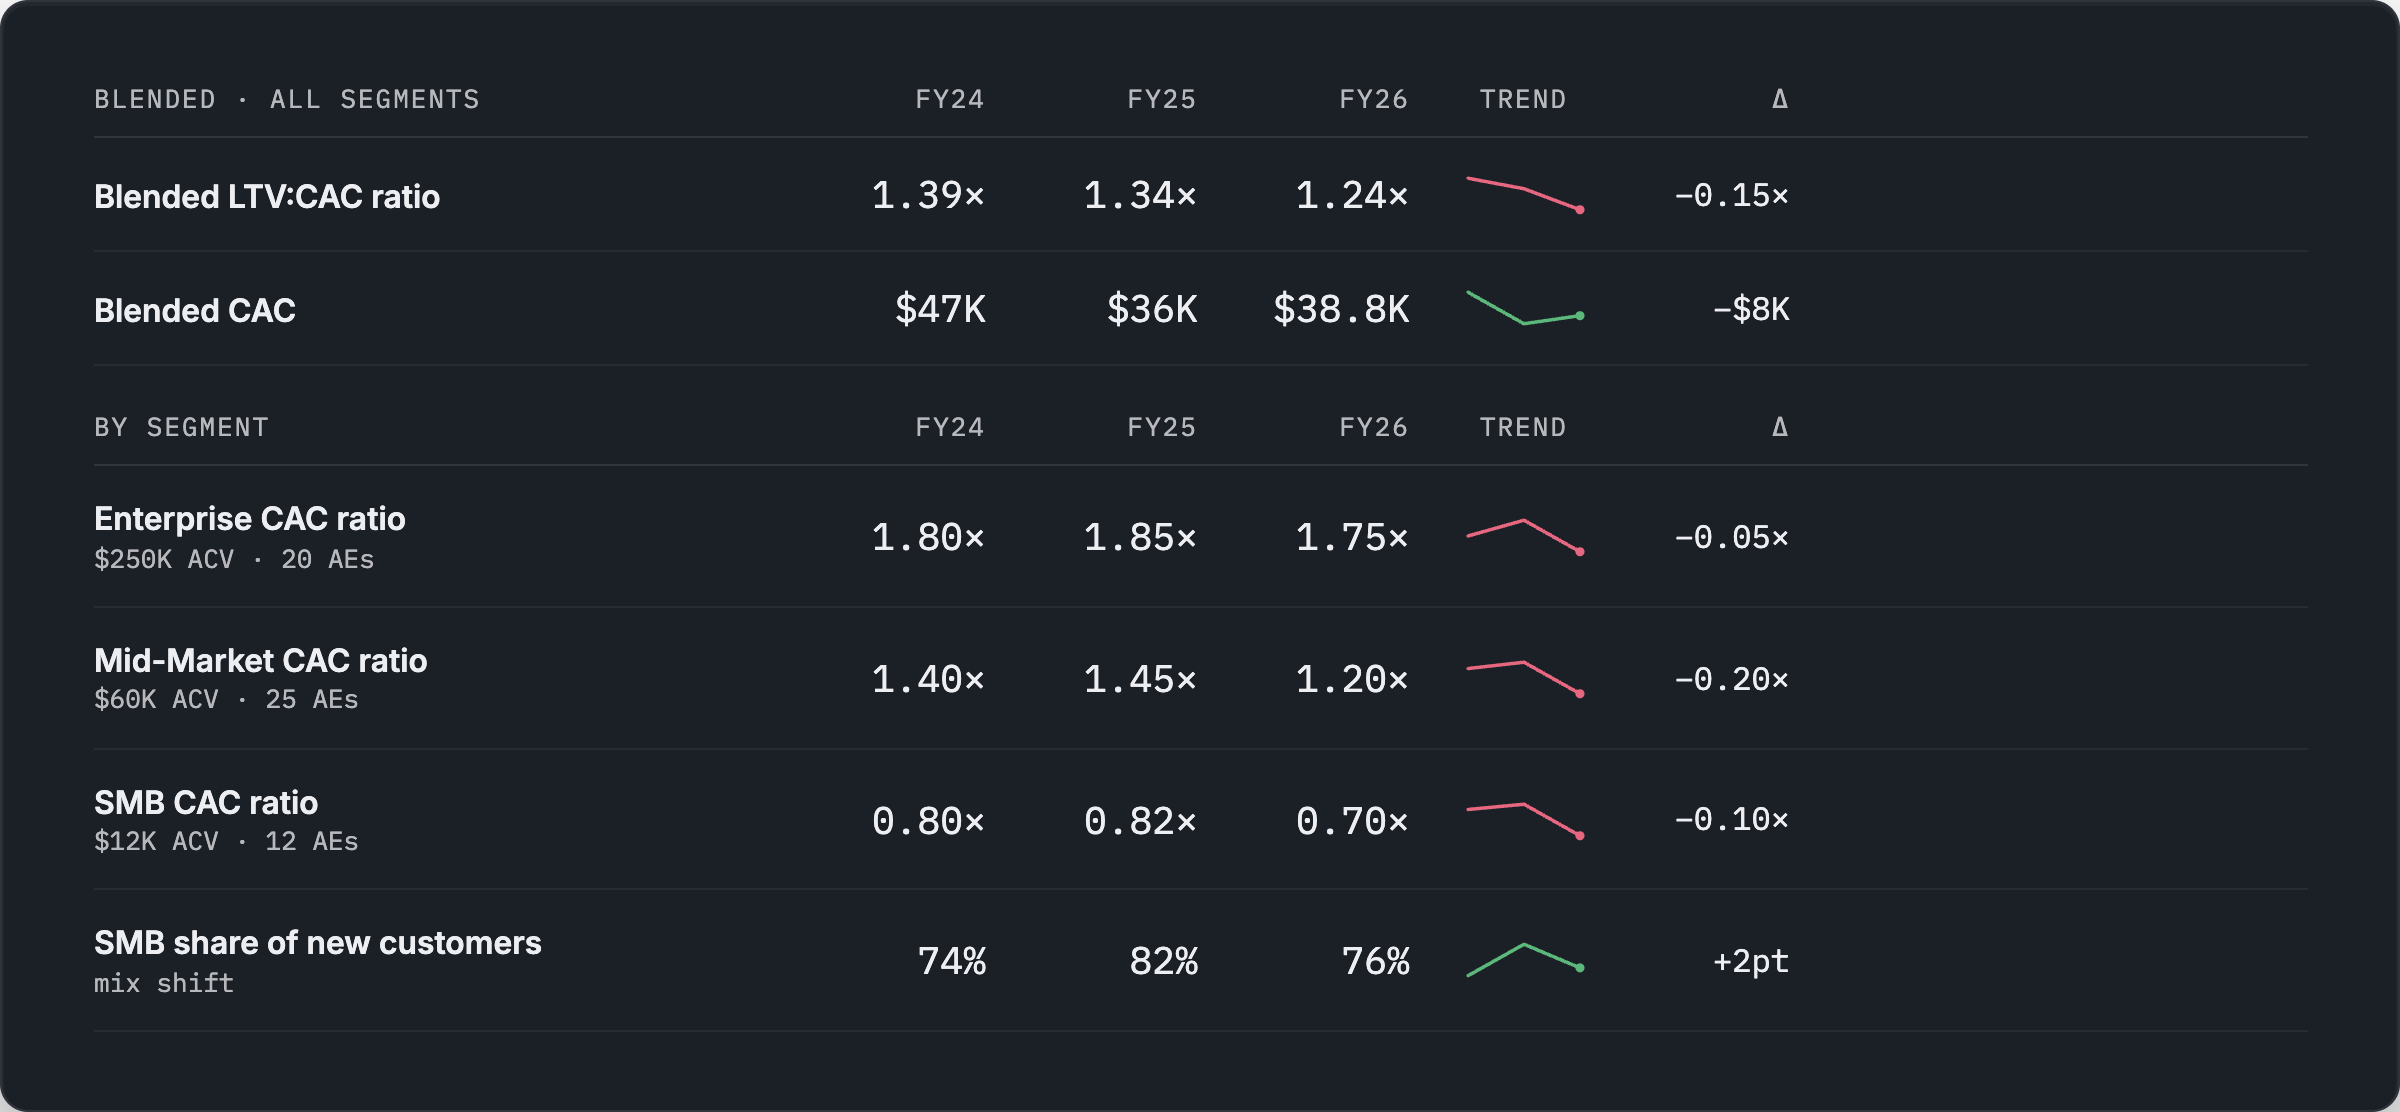
The mix just shifted toward SMB as a greater percentage of the customer count, where CAC is structurally lower.
Now, that’s still a pretty high-level example. But the idea is the more granular we go (cost per qualified opp, stage conversions, cycle time, ACV, etc.), the more we’re going to find different takeaways for different segments.
(Part 3) People Decisions (Both Reps and RevOps)
Model the distribution of your reps: how wide is the bell curve, and can you skew it even further?
As a simple thought experiment, say you have only two sellers on your team, and a CFO reaches out to you as a warm referral. Which rep do you intro them to?
Rep #1: closes 55% of the accounts they work, at $98K ACV
Rep #2: closes 15% of the accounts they work, at $58K ACV
It’s kind of a no-brainer. Rep #1.
I mean, why wouldn’t you send 100% of referrals their way? Well, eventually, they’ll hit a “productive capacity.” They’ll get tapped out, so adding more accounts to manage drops their close rate and creates diminishing returns.
So instead of pushing your GTM team to “raise the floor” and get underperformers up to quota, first ask: Can we skew the bell curve further to the right? It’s the highest-probability bet.
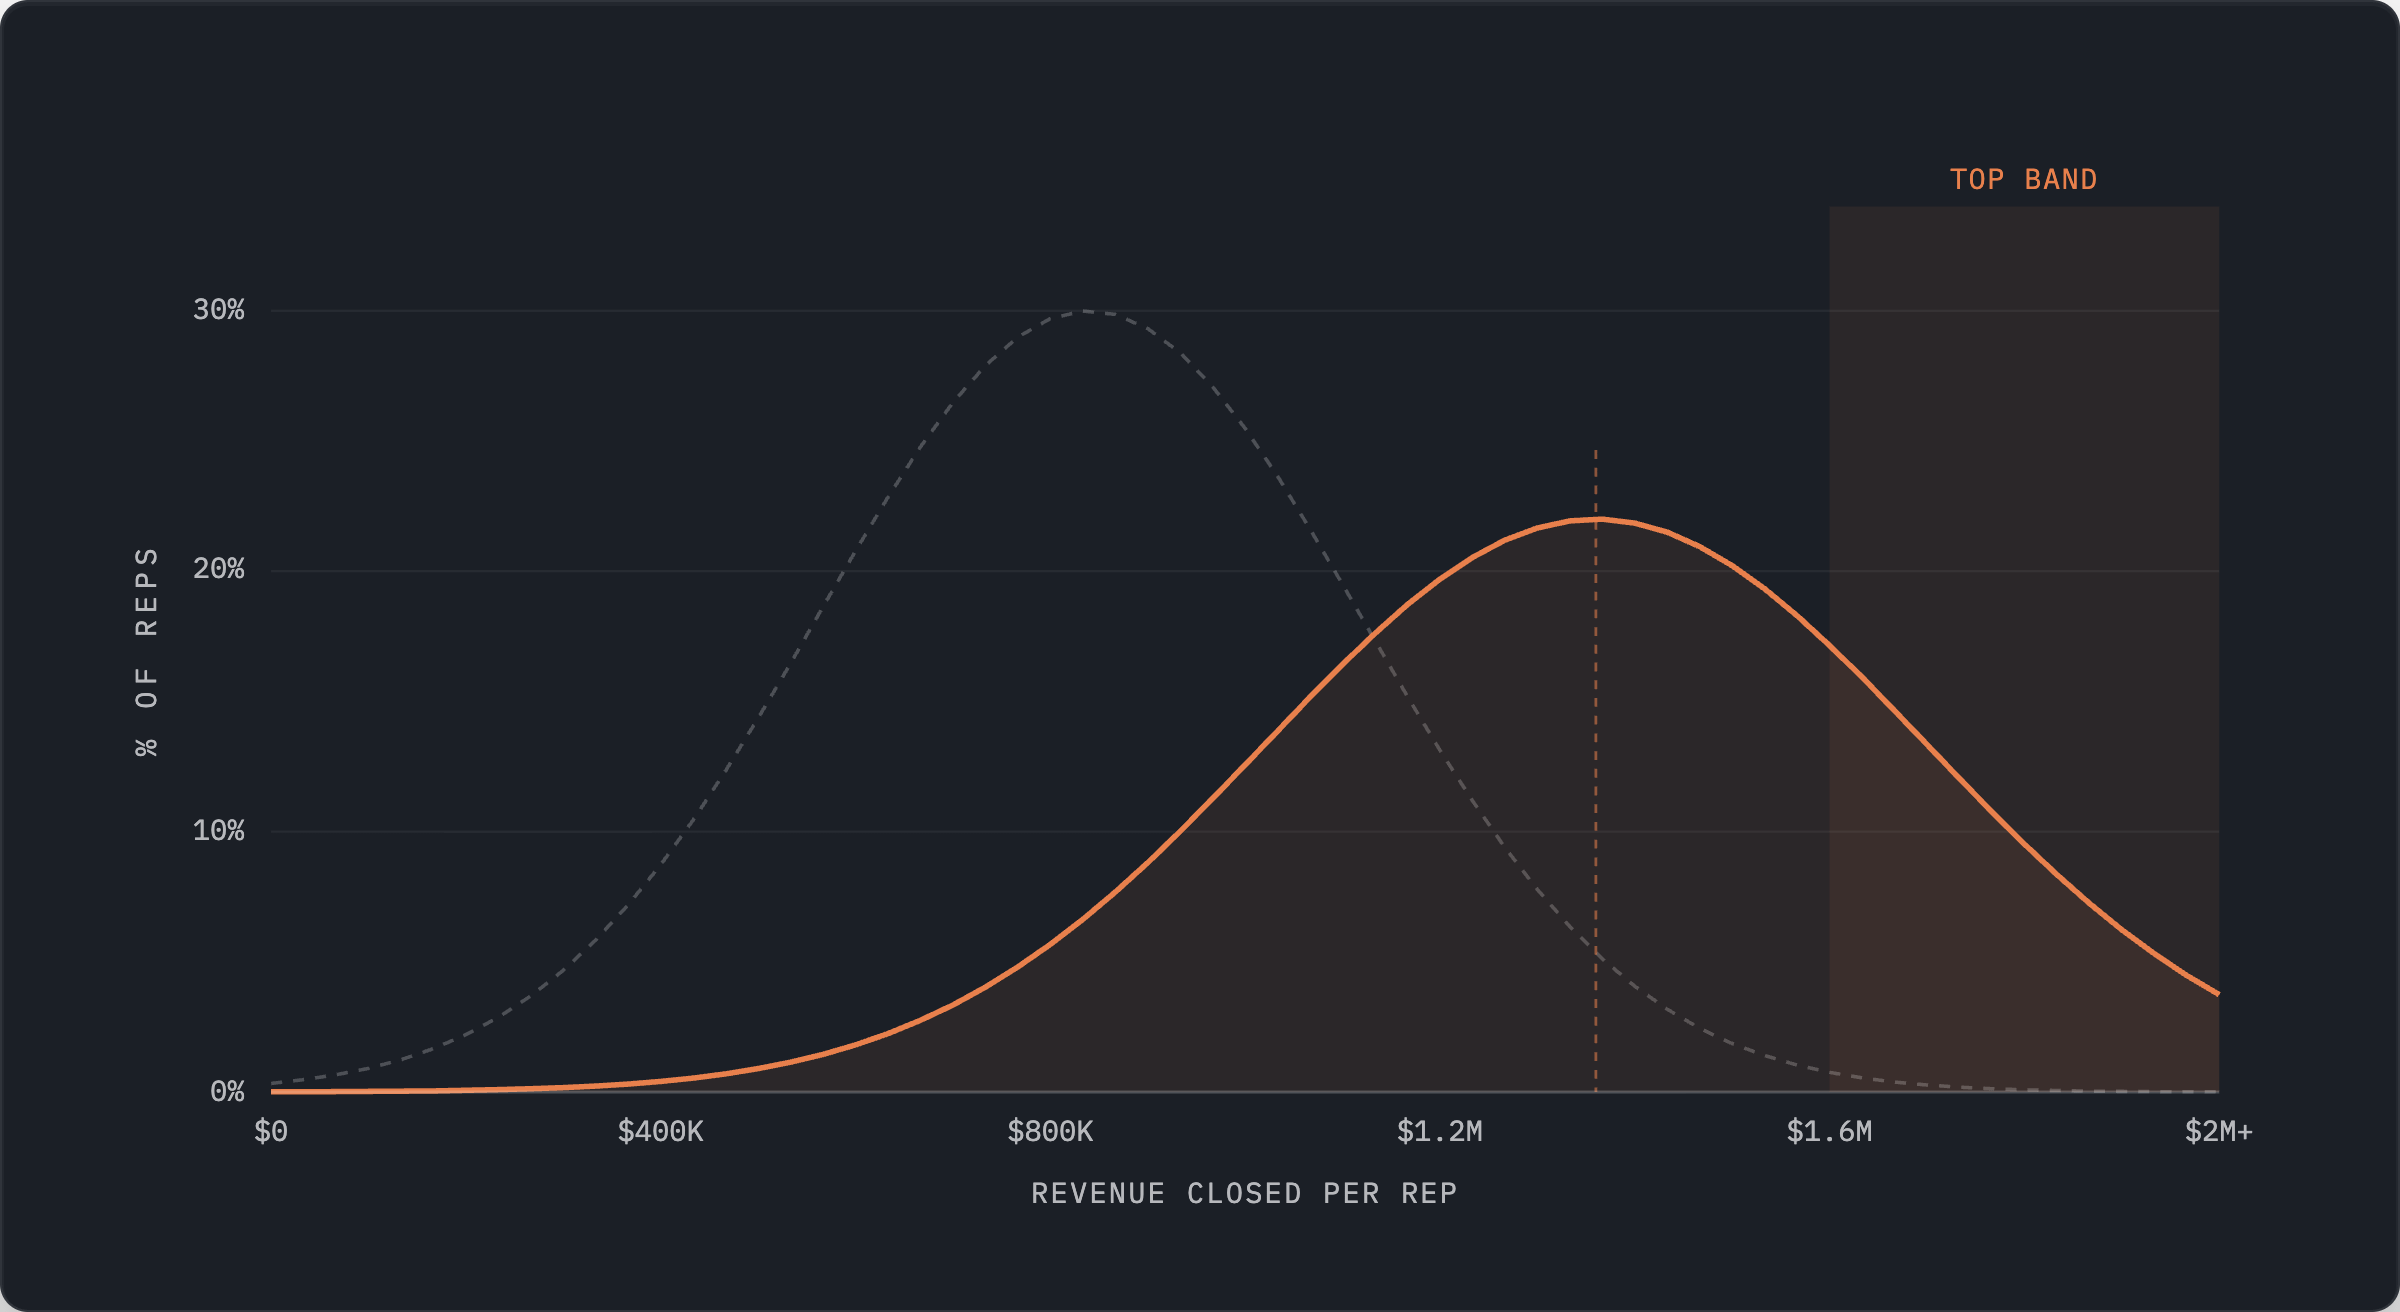
Similarly, ask: What changes did we make to our GTM process, to drive up our reps’ “productive capacity?” How many more accounts are they working?
I’d much rather lean into the contribution we earn from more variable pay to high-performing reps who’ve cleared their base + benefits, vs. grow off a larger number of average reps.
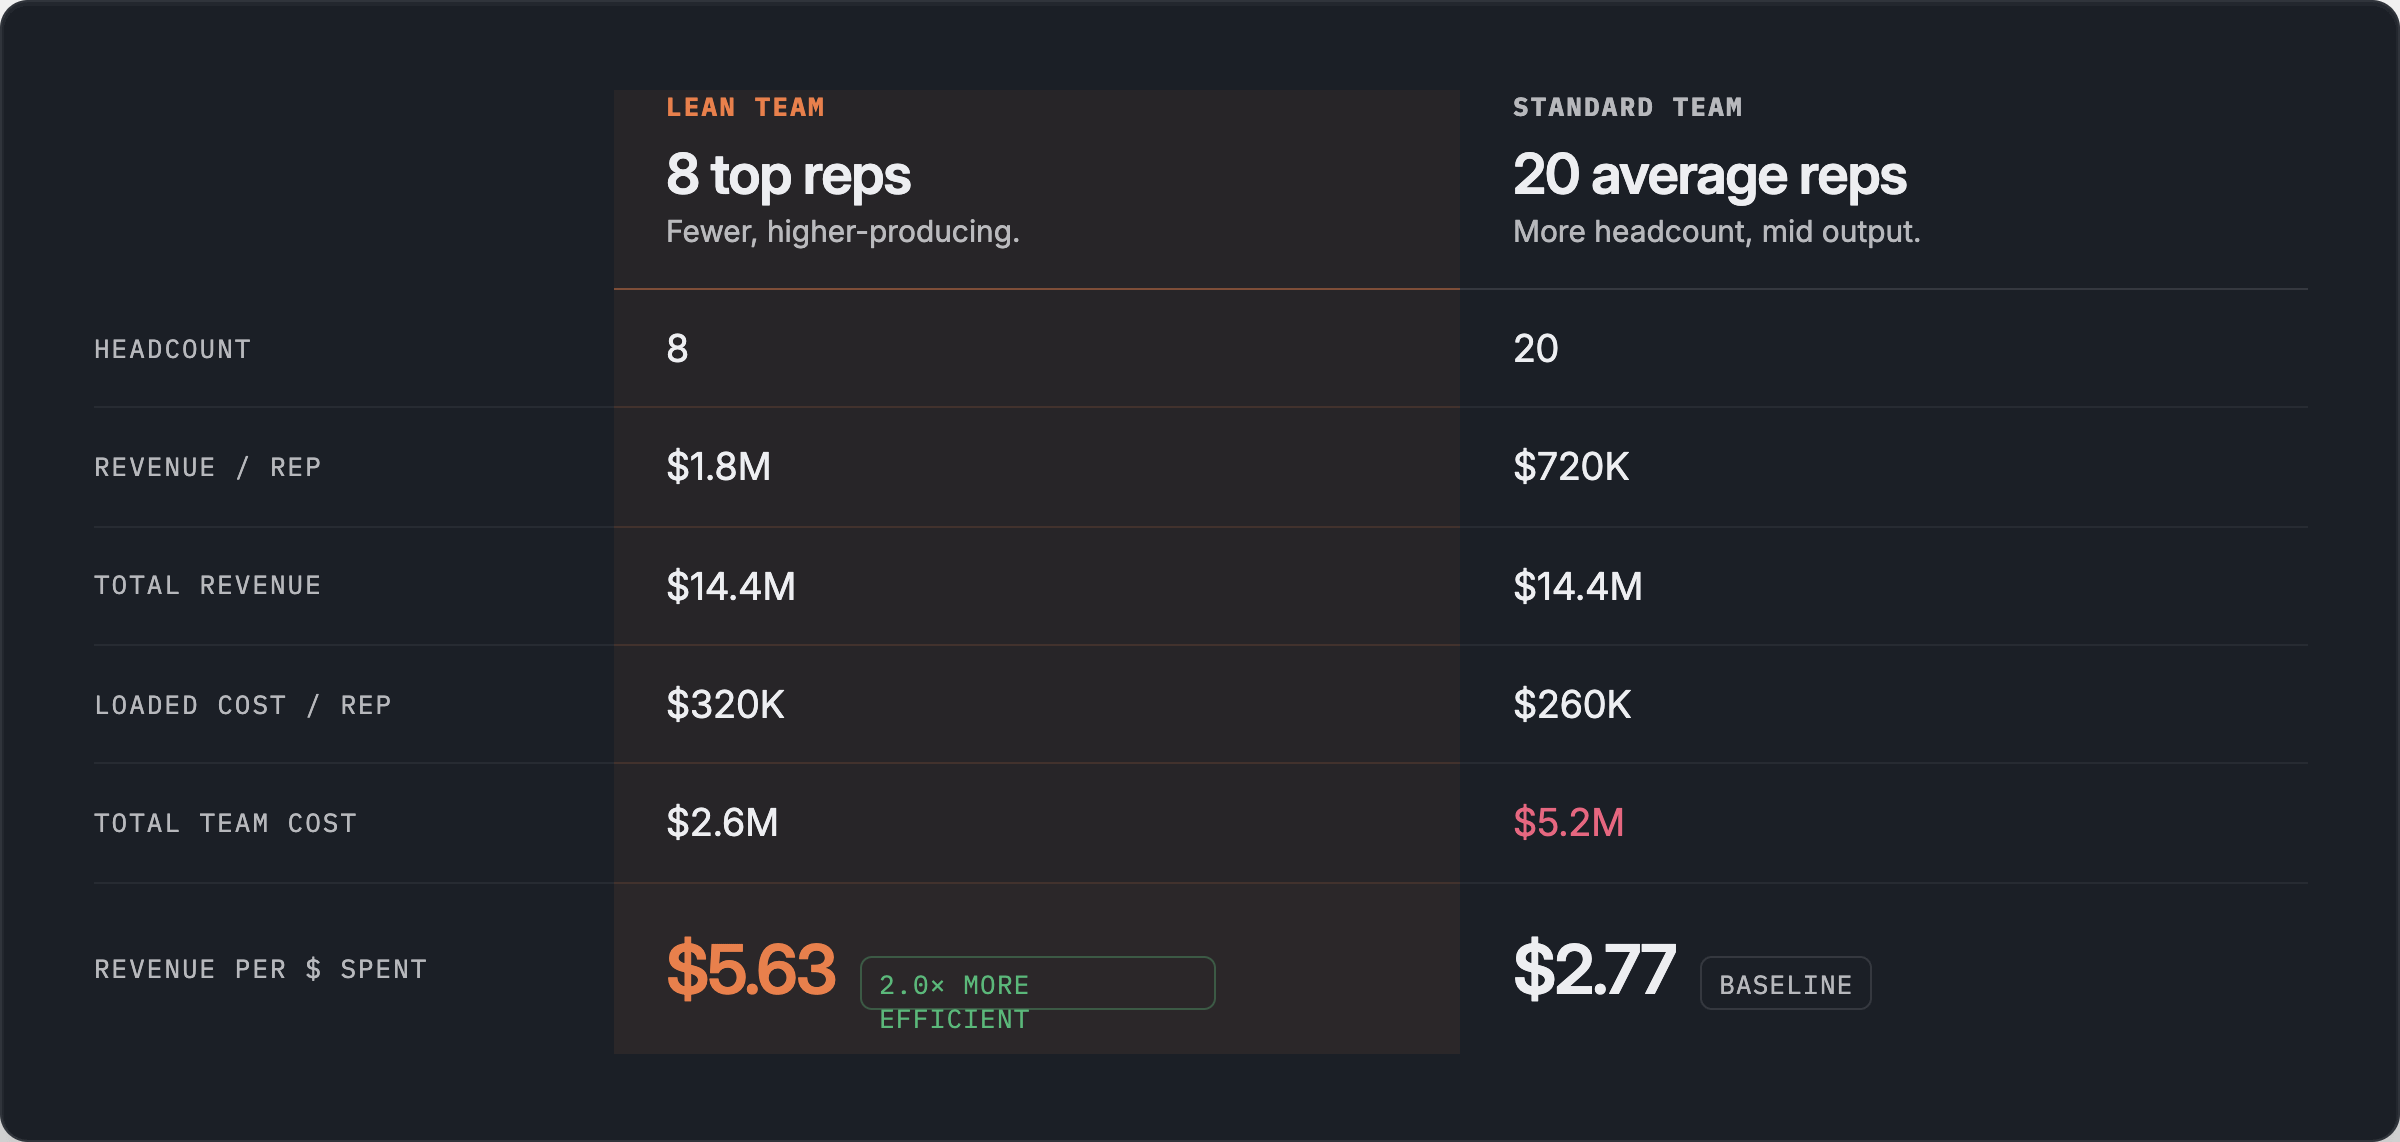
Ramping new reps is now an infrastructure vs. a talent question.
The old way of ramping a sales hire was a big PDF playbook, updated once annually at SKO.
The new model is a “living” system that rewrites itself based on the GTM data that’s changing every week. More “flywheel” than “process.” Which just couldn’t have existed 18 months ago.
The idea here:
Your top-performing reps at the front of the bell curve (above) often “work in the dark.” They have a gut-feel that drives them to make different decisions, and that judgment isn’t captured anywhere. So when they leave, that knowledge leaves too.
But that judgment is as valuable as any asset capitalized on the balance sheet today.
If this sounds like an operations problem, in my experience, it’s a comp problem, too.
With AI, now, you can build a model that makes those subjective judgment calls from top performers an explicit dataset.
That model is constantly trained on your actual GTM motion, not the market average (a general LLM), to guide new hires.
But first, you need to trace a top rep’s set of behaviors, with them actively contributing training data back into the model.
To make sure they do that, create a SPIF that gives top reps a payout based on their data added to the model. Which is them helping you build an asset, that’ll appreciate over time.
For example:
Let’s say a high-performer comes off an exec-level customer meeting, and the next step is to loop in the customer’s procurement team. Well:
Deal #1: the procurement intro comes in at 8:30pm same day, Friday night
Deal #2: the intro lands the following Wednesday, business hours, at 10am
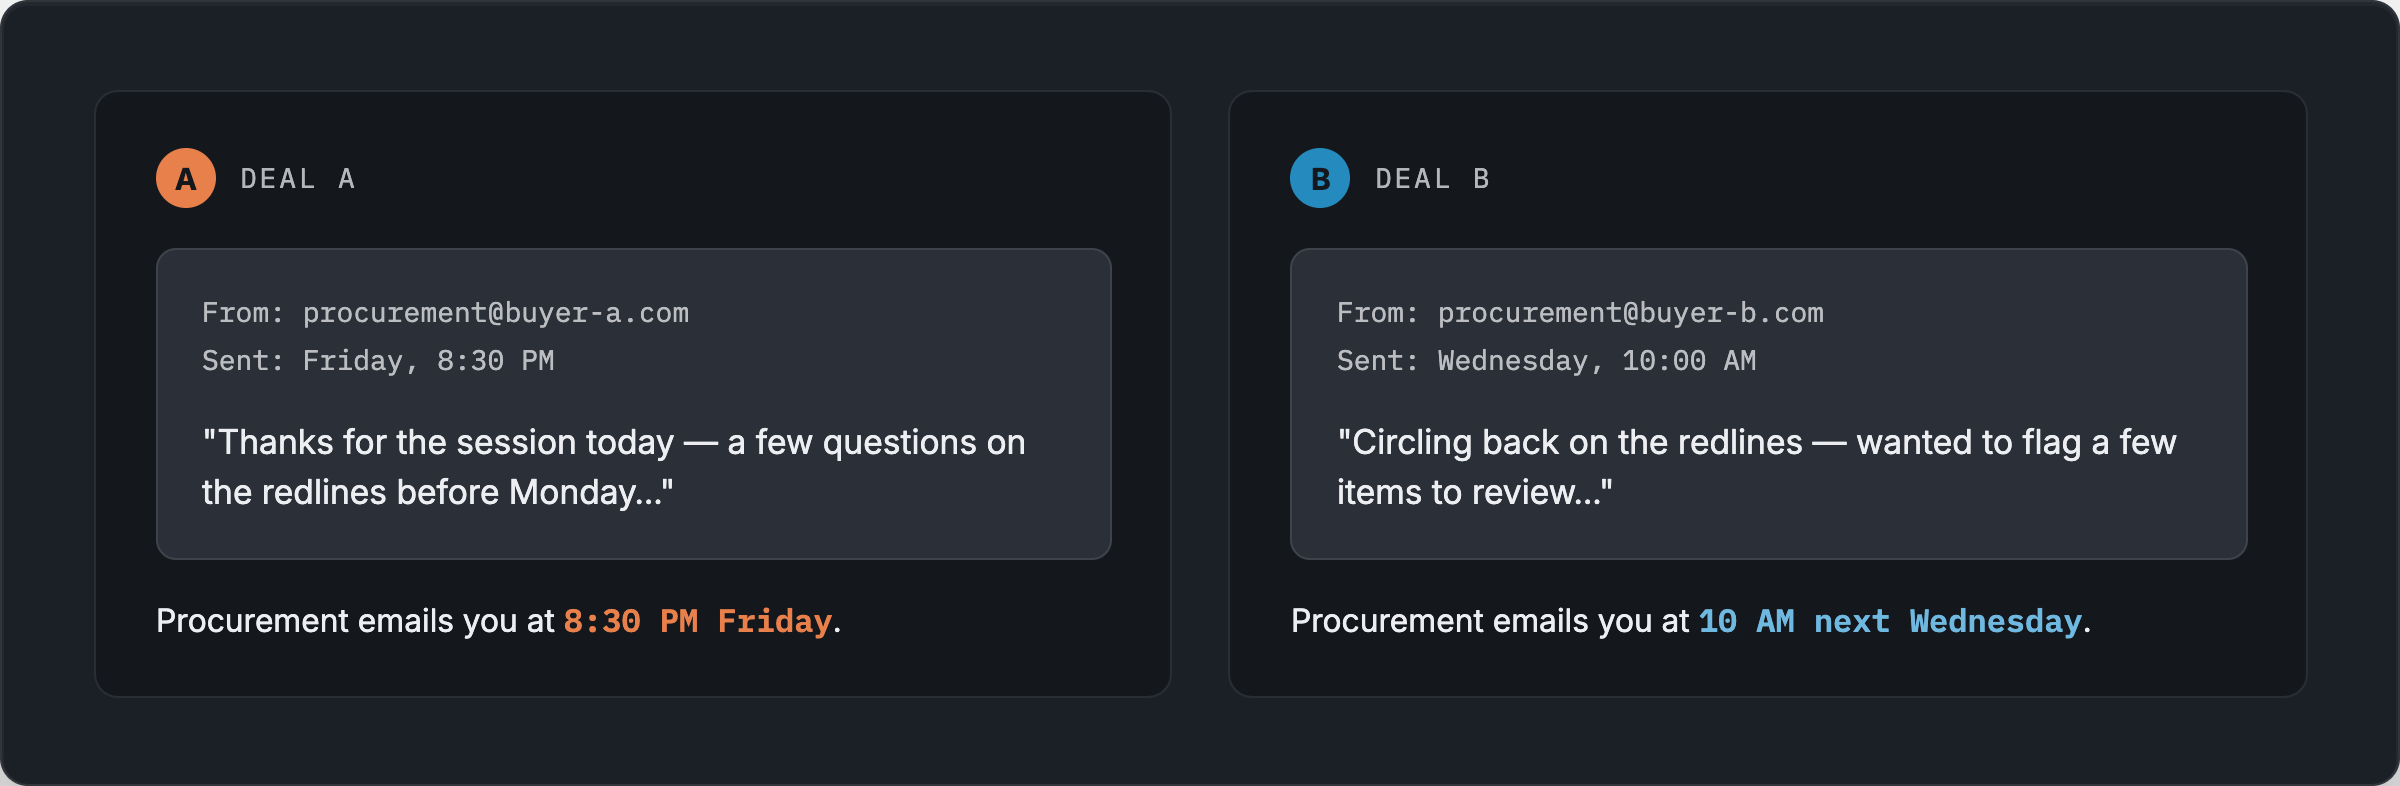
Those are WILDLY different signals on the level of priority. Which will change how a top rep approaches pricing and negotiation, to hang onto deal value, maximize commitment terms, etc.
The model traces that change in behavior, and feeds direction to a new hire to act similarly. Which moves them closer to the ACV, win rate, etc. of a top hire.
Ultimately, that means you’re funding and grading RevOps and Enablement based on their ability to compound revenue in a system, which should show up in your rep cohort data:
Did the last class of sellers ramp faster and hit a higher level of revenue-per-rep than the cohort before them?
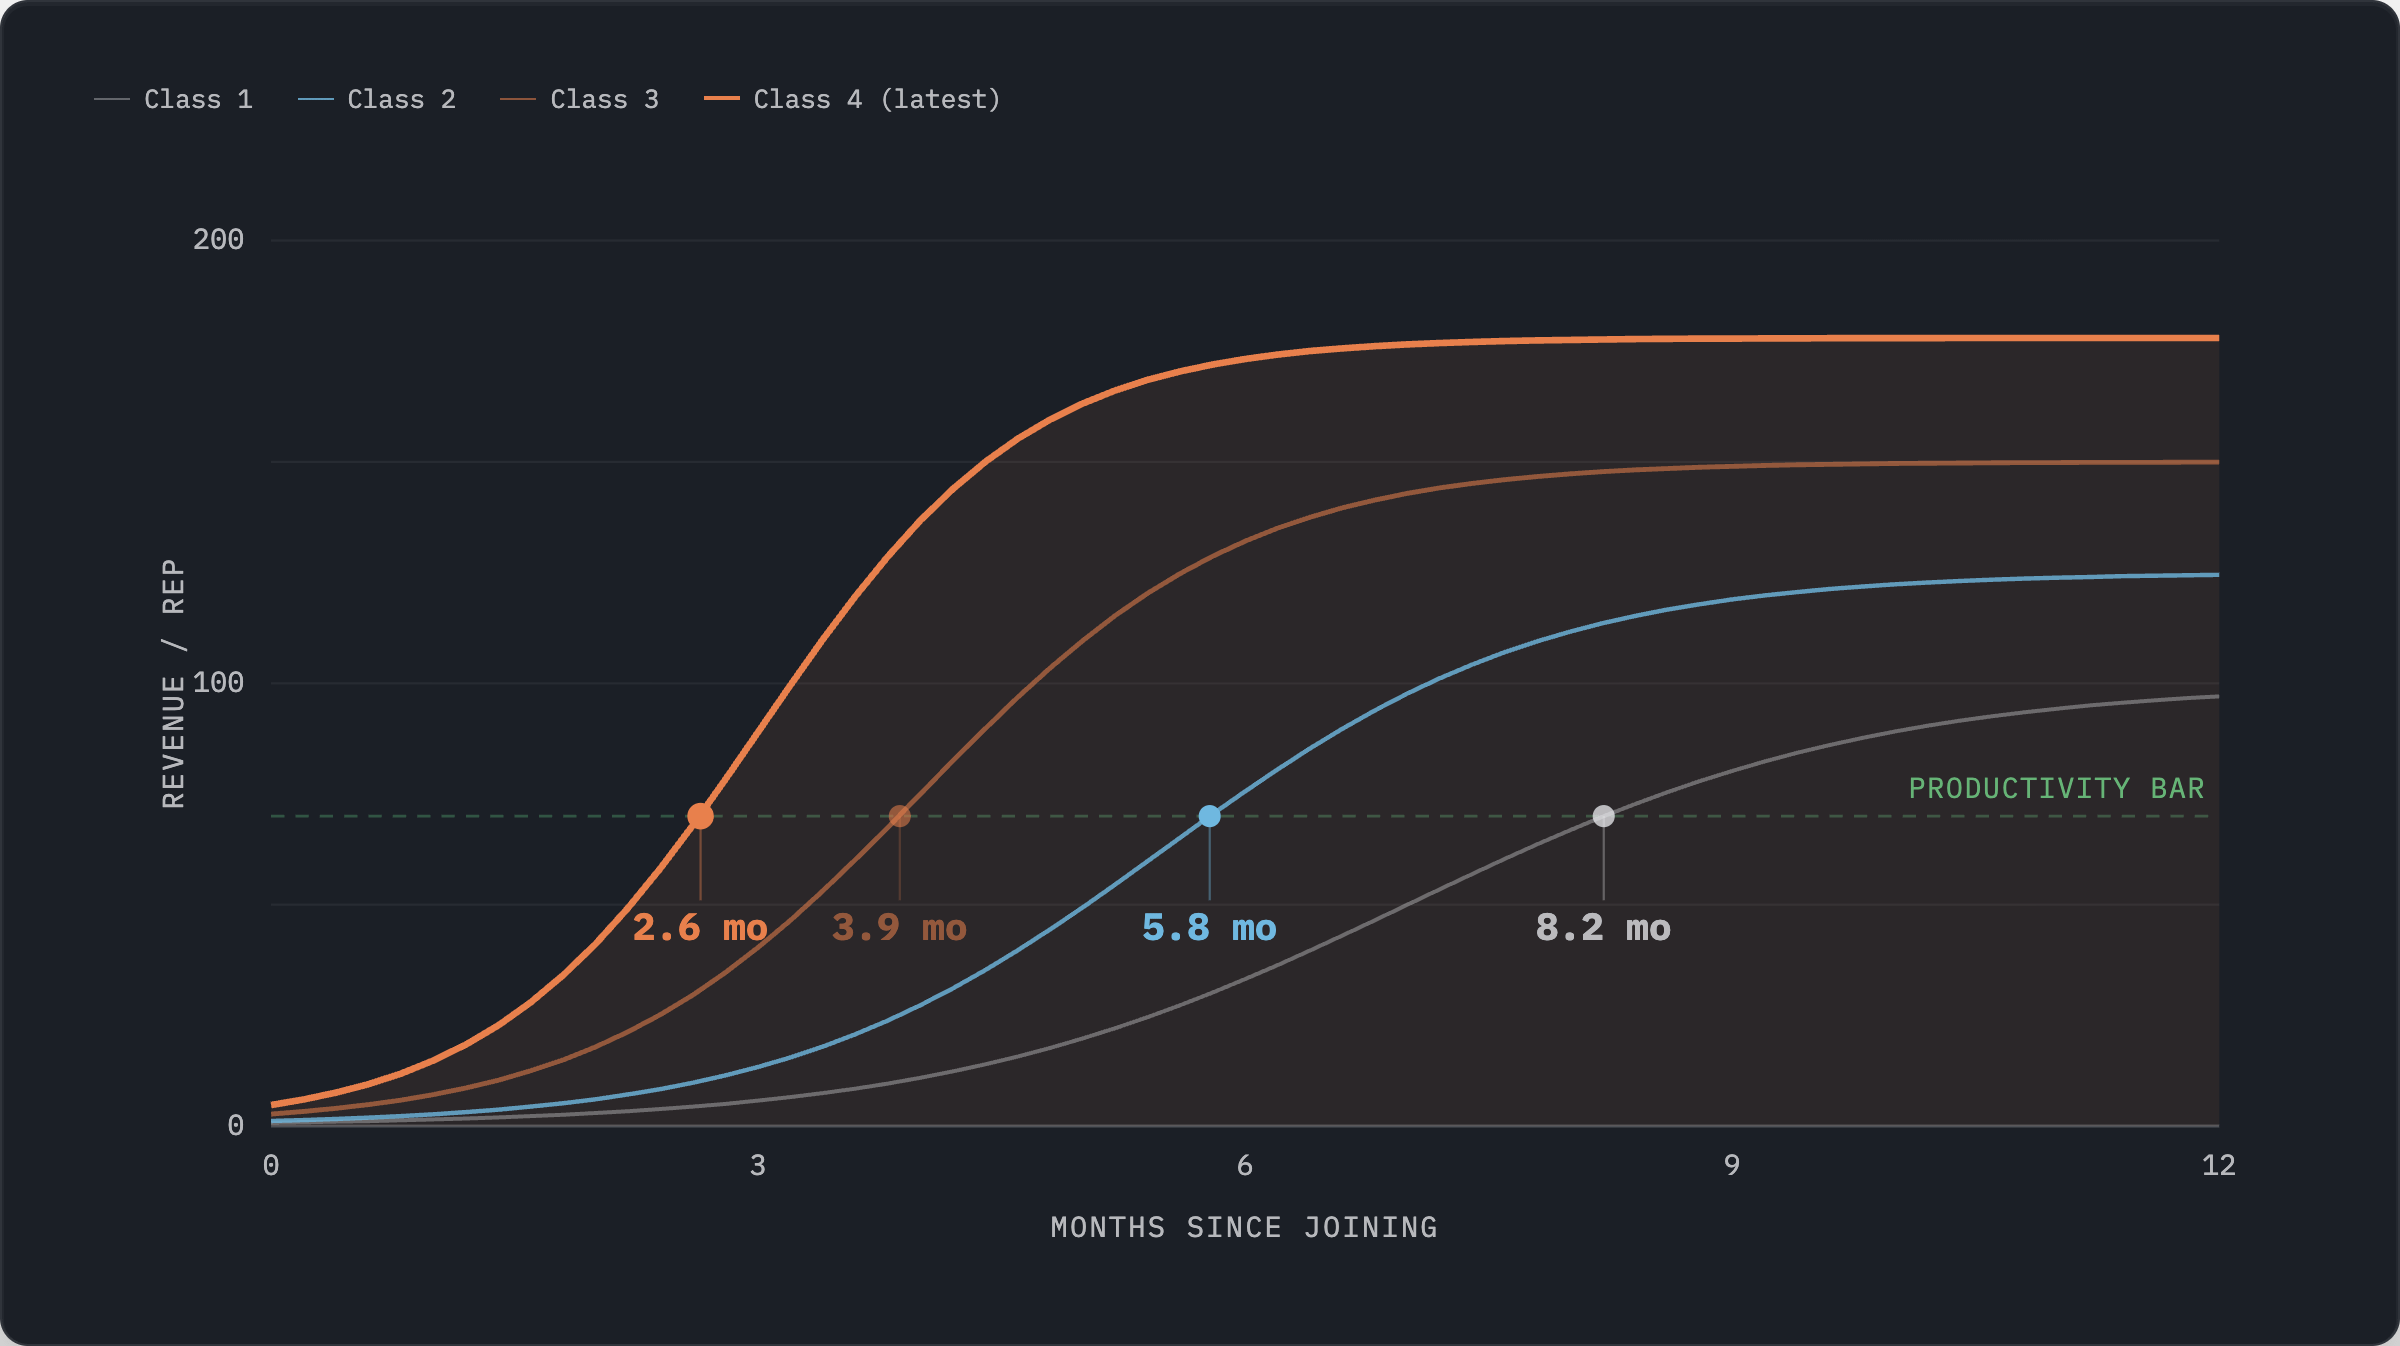
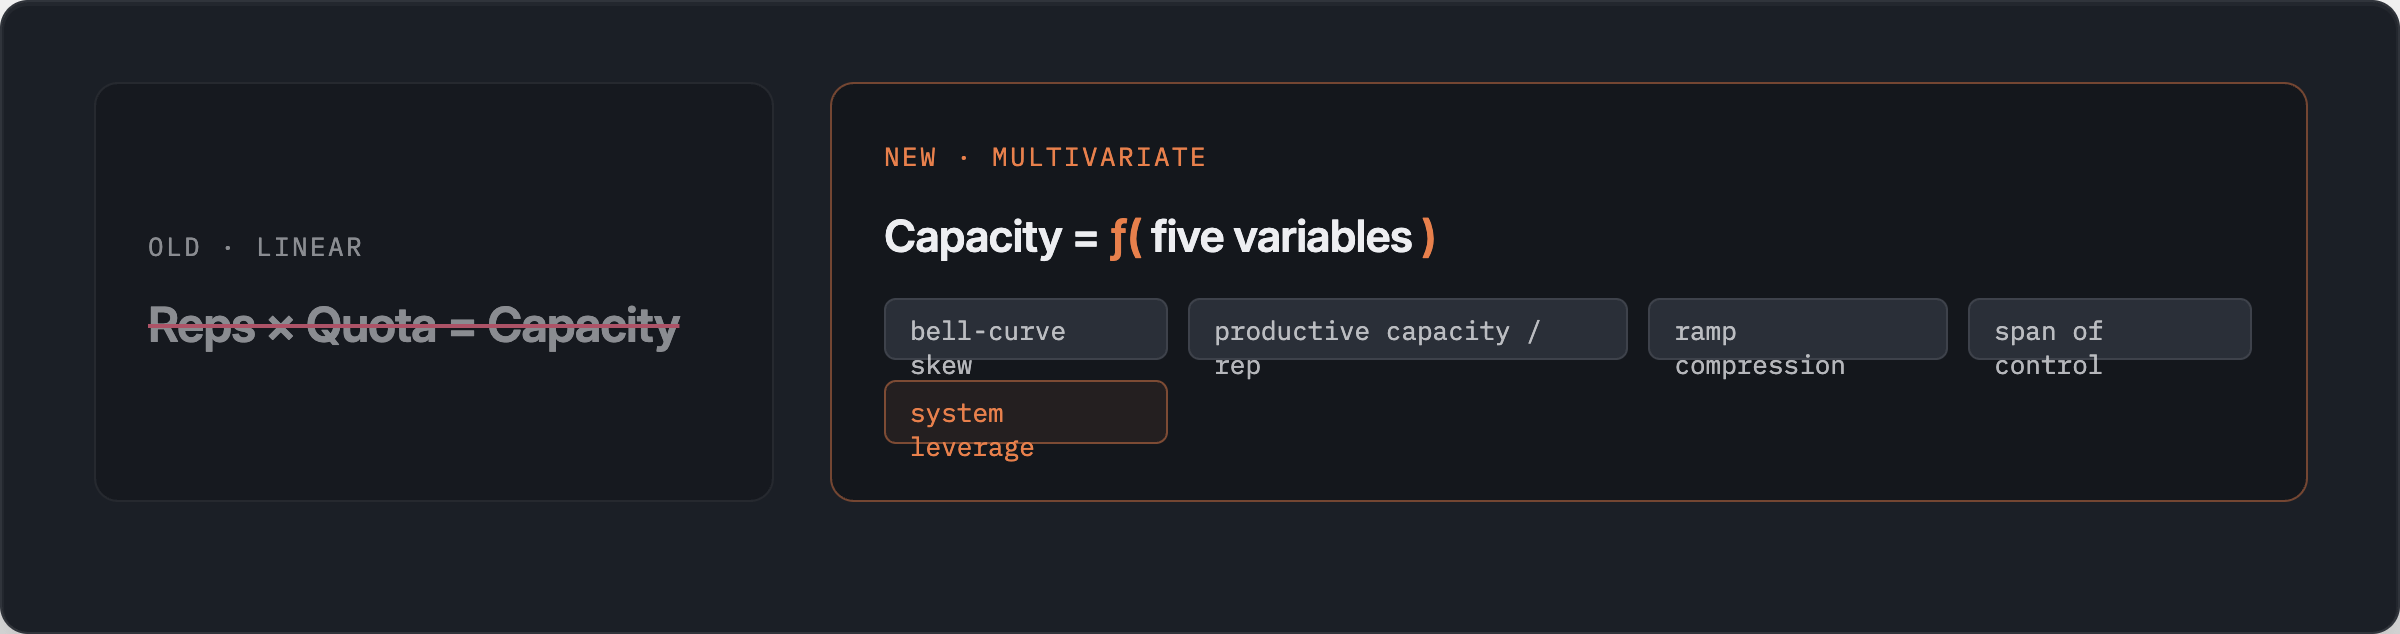
Capacity planning isn’t “linear math” any more.
It’s more like a multivariate equation.
You used to say, well, “We need X ramped reps, with Y quota, to create Z sales capacity…” But based on the above, there’s a whole set of variables changing beneath that.
Like how far the bell curve is skewing, how much the productive capacity per rep is changing, how quickly ramp time is compressing, how far the span of a leader’s control is expanding, etc.
My old board chair, Lee, used to tell me, “Sometimes Nate, you’ve got to sustain the pain to find the gain.” And what he meant was that we deliberately had to understaff to see how far we could push the system.
I’d suggest FY27 planning is a ripe moment for this. With a choice as you add sales capacity:
What % of sales capacity do we expect to add from new headcount?
What % do we expect to add from “system leverage”?
How does that split compare to last year?
I’d expect that split to skew more towards the system than the seller, toward revops and not just reps, as more dollars are used to expand top rep capacity, vs. just seats. (And as I’d come to find out, the regret cycle of an unnecessary hire is longer, and comes with severance…)
What did you change in your rep’s job description? In RevOps’?
Sales Reps:
As an example of what I mean, earlier this year, after we’d rolled out comp plans, we realized that a more technical product mix (which starts self-serve before a sales-led motion), doesn’t lend itself to the typical, “AE sells the logo,” then “CS onboards and retains.”
Instead, we needed to move to a single account-owner structure, with technical enablement. Where Account Directors own the account from first contact through full customer lifecycle.
Which meant cutting our CS org (hard but necessary), and now, judging our ADs (and paying them) based on a combo of new logo activations, upsells, and retention.
Which forced a few “back to basics” questions for us:
Does the comp plan match the job description?
Where it doesn’t, what sales behavior do we want to measure?
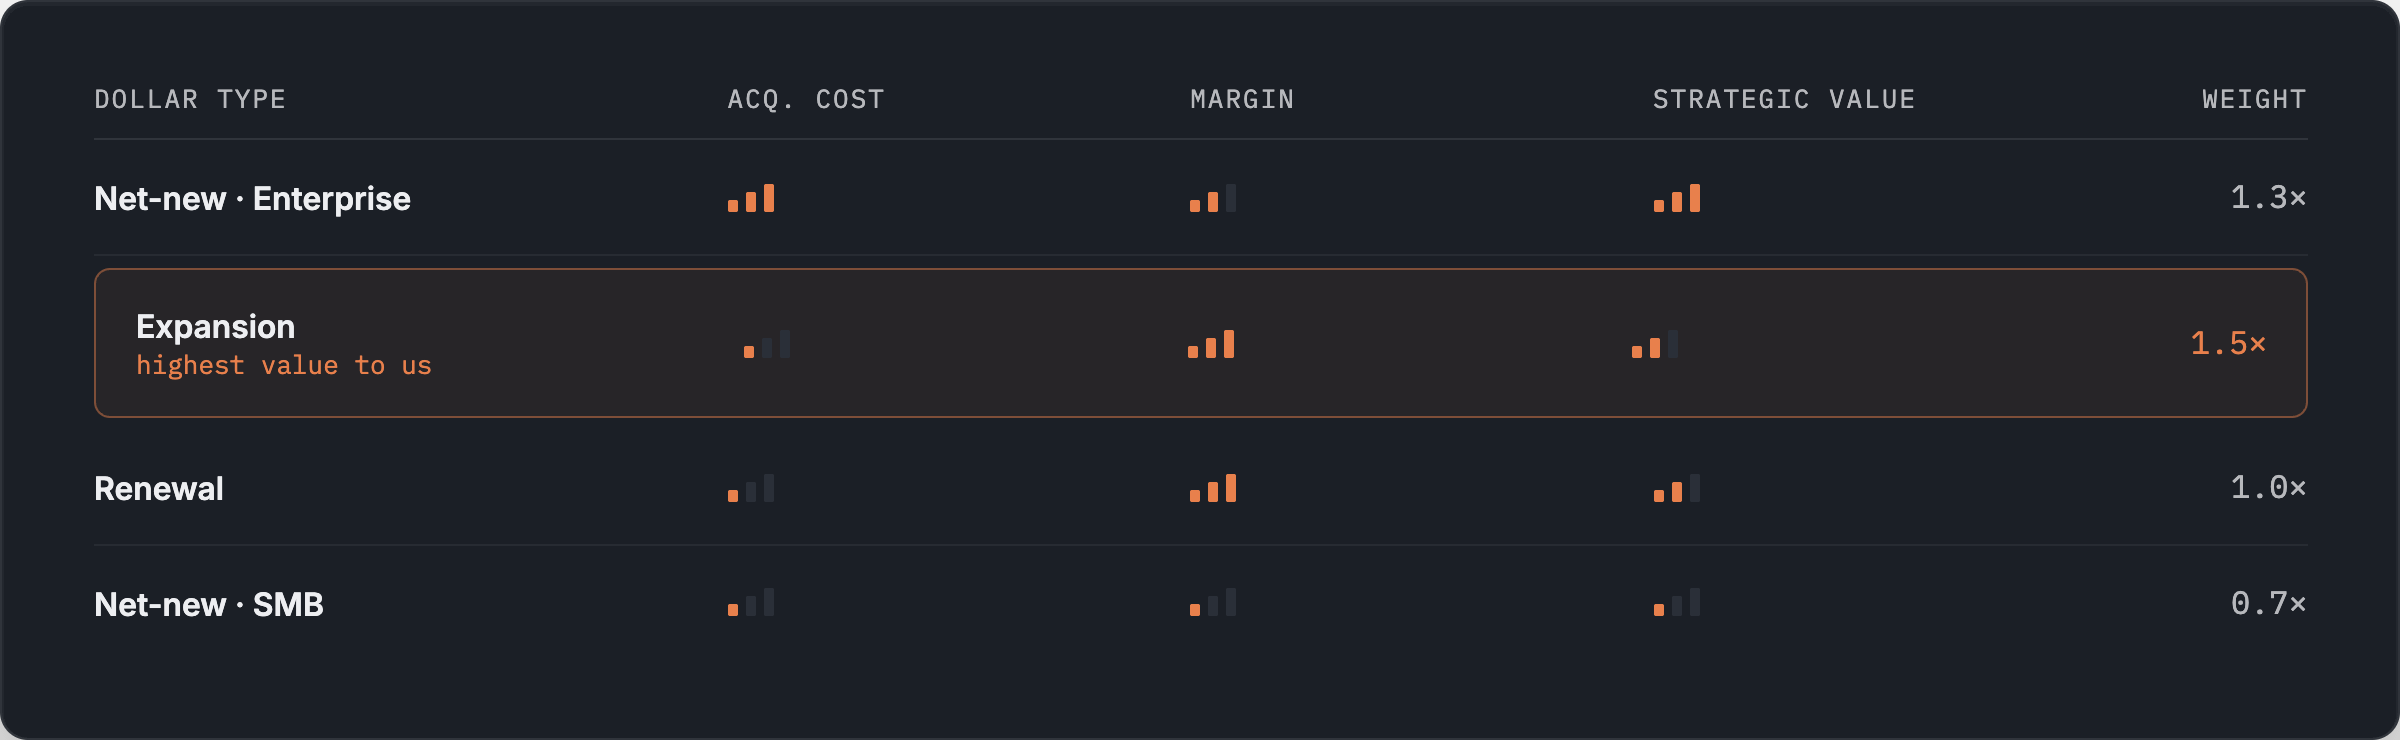
And, what “kind of dollar” is worth more? First spend from a new logo? Dollars committed in a multi-year agreement? What will it cost us to get that specific dollar vs. any dollar?
Here, it’s worth noting reps generally optimize for whichever dollar is the path of least resistance. So if the price you pay for each dollar is equal, they’ll figure out a form of “commission arbitrage,” moving toward the segment that’s easiest to get new commission dollars, to exchange them for what feels like a higher payout.
Which you can rebalance with a type of dollar “taxonomy” (net-new / expansion / renewal, by segment) based on the CAC / margin / strategic value to you.
RevOps:
Back to one of the earlier questions we asked: if AI agents are expected to enable an increasing share of revenue, but they don’t carry a quota, how do you measure them?
Or more accurately here, how do you comp their creators?
The RevOps job description is splitting into two directions right now:
AI: The engineering function responsible for architecting systems that both learn and execute (creating new data to learn from in a loop).
BI: The reporting and rules functions to dashboard the outcomes, and ensure there’s consistency in operating rhythms across the business.
As an example, Scott Gibbs from Meltwater describes the new RevOps functions they created to enable this. The revenue engineers need upside, and while the comp norms are still being established, the one question I’d have for you is:
Is the RevOps org on the hook for driving a greater share of the variable revenue outcome?
If so, to what extent will they share in the upside of a good outcome, with variable comp attached to it? More than last year?
To be clear, I don’t think this looks like a commission plan for RevOps. But it does look like a direct conversation on how their role and compensation are being reorganized.
Slope, not intercept.
The rising tide of AI does not float all boats. So while it’s good to evaluate the efficiency gain AI brings to the revenue org as a whole, I’d suggest a more granular, rep-level look.
It helps to evaluate each rep as a “line, not a dot.”
Buying behavior is changing fast, and a seller’s ability to evolve with it isn’t guaranteed. (In case that wasn’t already obvious.) So, my suggestion is to create a simple line chart of trailing Revenue:OTE on one axis (the “intercept”), with their trajectory over recent quarters on the other (the “slope”).
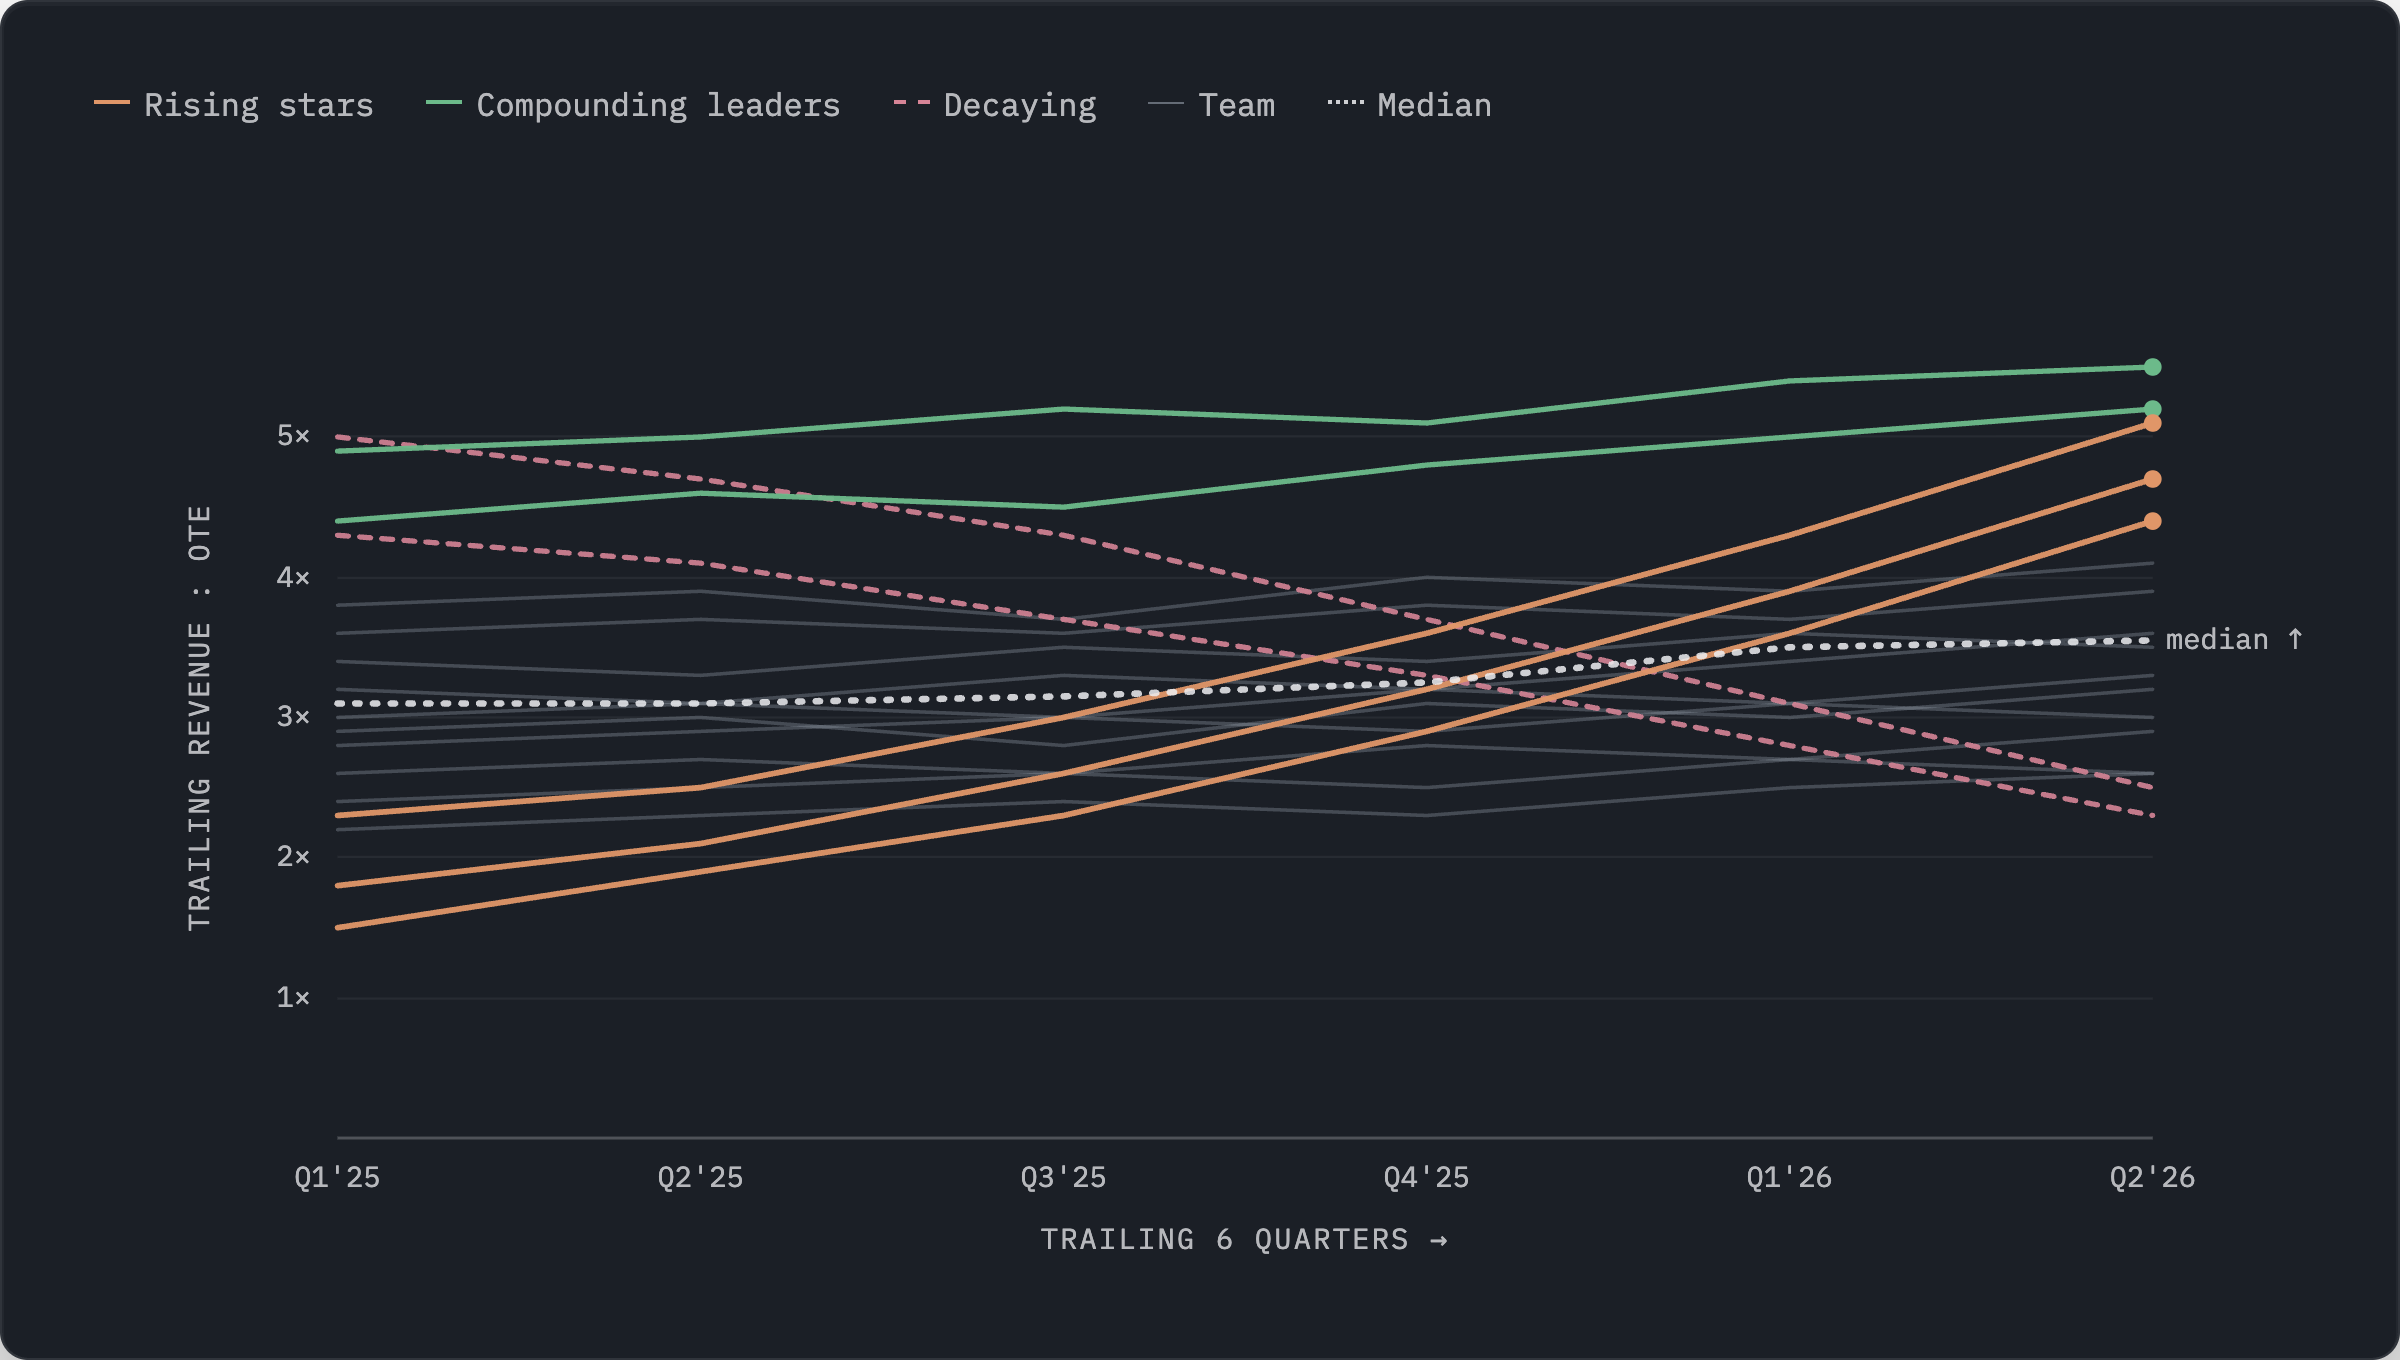
Then, you can split that grid into quadrants:
Who were previously the bottom-half performers, that have been accelerating fastest? (Likely a future asset that an annual stack rank may have thought to begin managing out, but, could be among your rising stars.)
Who were previously the top-half performers, whose performance may be “decaying” over time?
And collectively, is the median trend line up, or down, midyear? Is the “system” working?
So, where do you go now?
Back to Fred and his pedal car:
The teams still running on floating highways will treat AI as a line item to cap, and they’ll get what they measure: the same motion, just a little faster, with a new expense to explain to the board.
Vs. the teams refactoring for the AI era see it differently. Instead of bolting new tech onto the old roads, they’re building a system where ripping AI out of it would mean breaking the model.
So if you’re somewhere in-between the early 2020 motion and passing the “kill-switch test,” here’s where I’d start this week:
Check your dash. Was this gauge built for the old machine? Anything measuring topline effort (when effort was scarce and roughly equal to results) goes on the watch list. Move your attention to mid-funnel health, like stage-by-stage conversion.
Make FY27 planning about the “multivariate” equation. As you add sales capacity, force the question: what % do we expect from new headcount, what % from system leverage, how does that split compare to last year, and what operational changes did we make to drive it?
Evaluate the revops job description, and sales reps as “lines, not dots.” Plot trailing Revenue:Quota with a quarterly trajectory, find the rising stars, and over-invest in the top quartile of reps. While confirming your revops team is comped and focused on building the system beneath them.
Footnotes:
Join me and attend Rillion’s 2026 Finance AI Report webinar to learn how other CFOs are implementing AI
Subscribe and share the OnlyCFO newsletter with your teams
*Nothing in this article constitutes legal, tax, or investment advice. I am not a lawyer or tax accountant.