
Are Sales Reps Overpaid? | GTM Efficiency in 2025
Latest sales compensation benchmarks (including HC ratios) and tips/tricks for navigating sales rep compensation
Today’s Sponsor: Tropic

Q4 is almost here. And so are the renewals.
Over 30% of SaaS contracts renew in Q4, right in the middle of budgeting season. Tropic’s free Slack and Gong playbooks give you insider benchmarks, sharp negotiation tips, and contract gotchas from our procurement pros.
Three more guides (HubSpot, 1Password, ZoomInfo) are on the way. One sign-up gets them all. We’ve already helped customers save $56M in H1. Grab your playbooks and breathe easier this Q4.
Sales Rep Efficiency in 2025
The best sales reps should make 7-figures and be the highest compensated employee at the company (on a cash-basis).
I used to get jealous when I approved those massive commission checks. However, I eventually learned that when sales comp and the sales commission plans are working right, then my equity will be worth A LOT more.
But…I have also seen sales reps get paid WAY too much relative to the economics of the deal. It’s the CFO’s responsibility to make sure comp plans and deal economics make financial sense.
I will walk through how I evaluate sales rep efficiency, lessons I have learned, and share the most recent compensation/efficiency benchmarks from ICONIQ.
5 Ways To Triangulate Sales Efficiency
1. Quota : OTE Ratio
The longstanding advice for software companies is that the quota:OTE ratio should be around 4-6x. This means if a sales rep hits quota then they will create 4-6x more revenue than their total compensation.
The ICONIQ chart below confirms that this is still the expectation for the best companies.
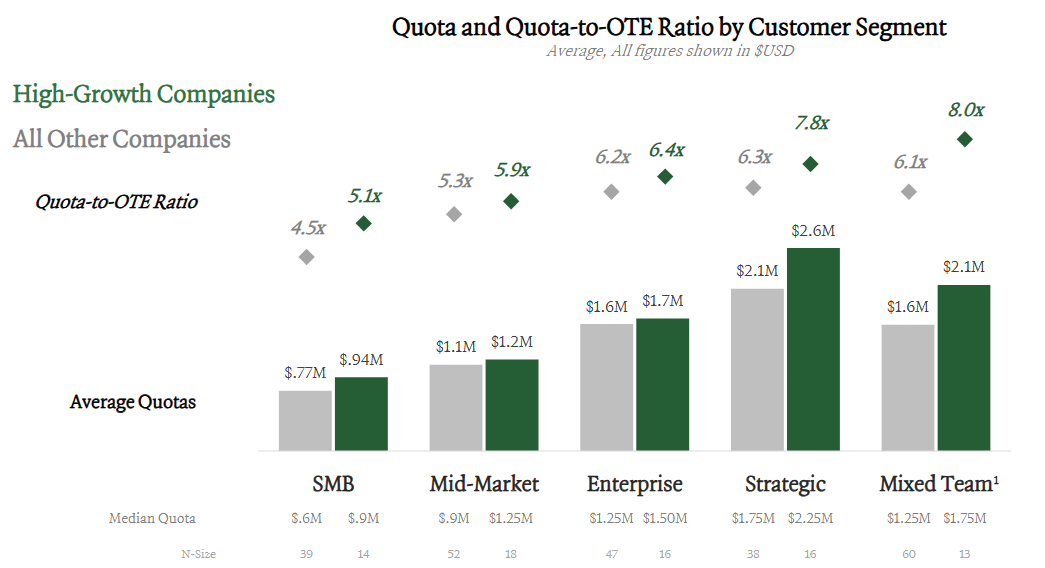
High-Growth Companies: They often have better ratios because they can pay reps more and have even higher quotas.
Smaller Scale Companies: Typically have smaller quota:OTE ratios because each sales cycle takes relatively longer as the processes, brand, etc are still immature.
Is a 4 - 6x ratio still good in the world of AI?
Maybe…But maybe not. You need to understand more than just the benchmarks to know (keep reading)
2. Attainment
Having a good quota:OTE ratio is great but it means nothing if attainment is low. You need to also review actual attainment vs OTE.
Below is ICONIQ’s attainment data by segment and growth bucket (high-growth vs everyone else).
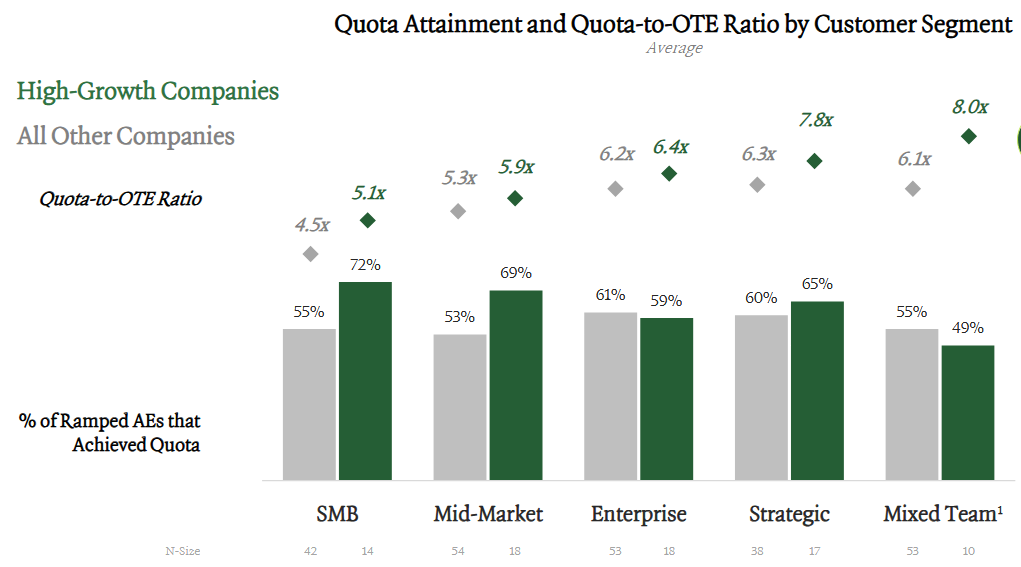
Not only do high-growth companies have higher quota:OTEs, but they generally have higher attainment as well.
Example:
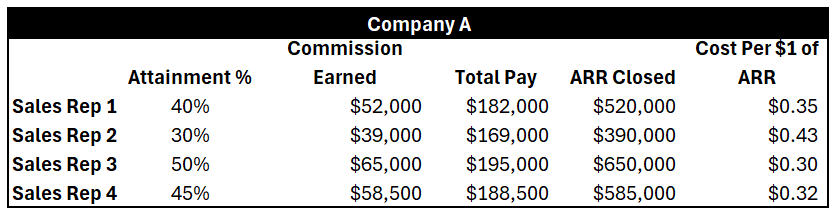
Let’s look at how attainment impacts sales efficiency with an example of two different companies with 4 sales reps. Below are the sales reps’ OTE and quota.
Company A has a low average attainment of 41%. The far right column shows the total sales rep cost per $1 of ARR closed (e.g. it costs $0.35 in payroll costs for sales rep 1 to close $1 of ARR).
Company B has a great average attainment of 81%. As you can see, the cost per $1 of ARR is much lower…
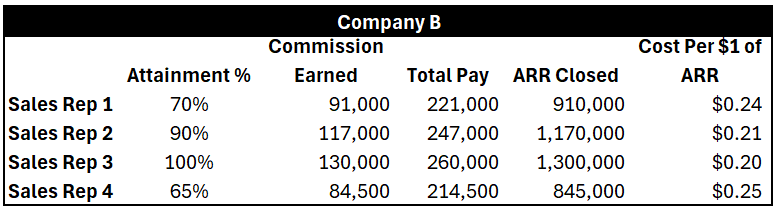
Company B is acquiring ARR 34% more efficiently than Company A! This is why your best reps are SOO valuable. Not only do they close better deals, but the reps with high attainment are a lot more efficient because the incremental dollars only cover commissions (versus base salary + commissions).
Most folks fail to realize how much more efficient great reps can be…
What’s the sweet spot for attainment? I still like the rule of thumb of roughly 80% of reps at an average of 80% attainment. It’s hard to hit targets but achievable and there is a high average attainment.
3. Commission Rates
Looking at commission rates is also helpful to think about — for every $1 of revenue brought in how much are we paying sales reps?
The medians are fairly consistent from when ICONIQ did this benchmark a year ago, but the bottom and top quartile amounts are higher - for new logos the bottom quartile is 2 percentage points higher and the top quartile is 6 percentage points higher. Reps are getting paid more relative to revenue brought in…
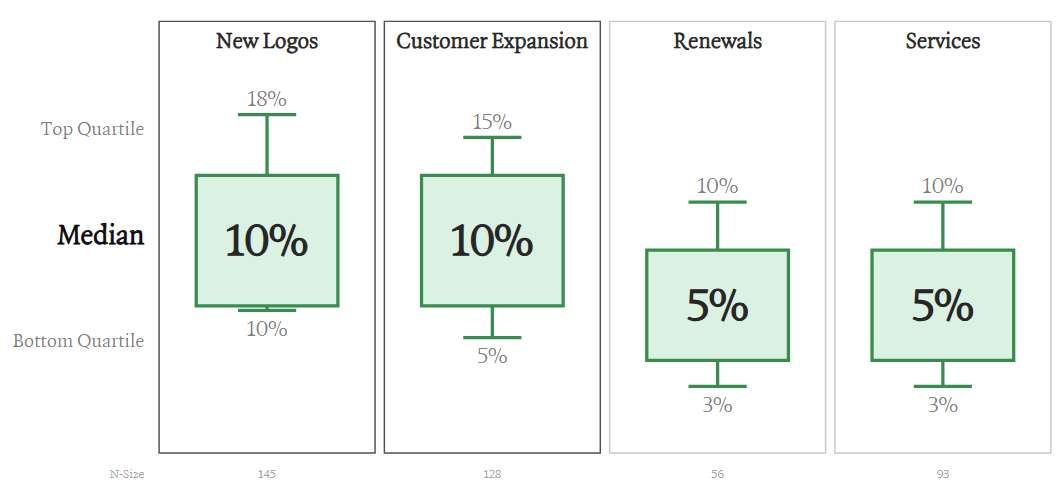
An 18% commission rate seems dangerously high. So unless the “GTM pod” is REALLY small, those unit economics will be hard to make sense (see below on “GTM Pods”)
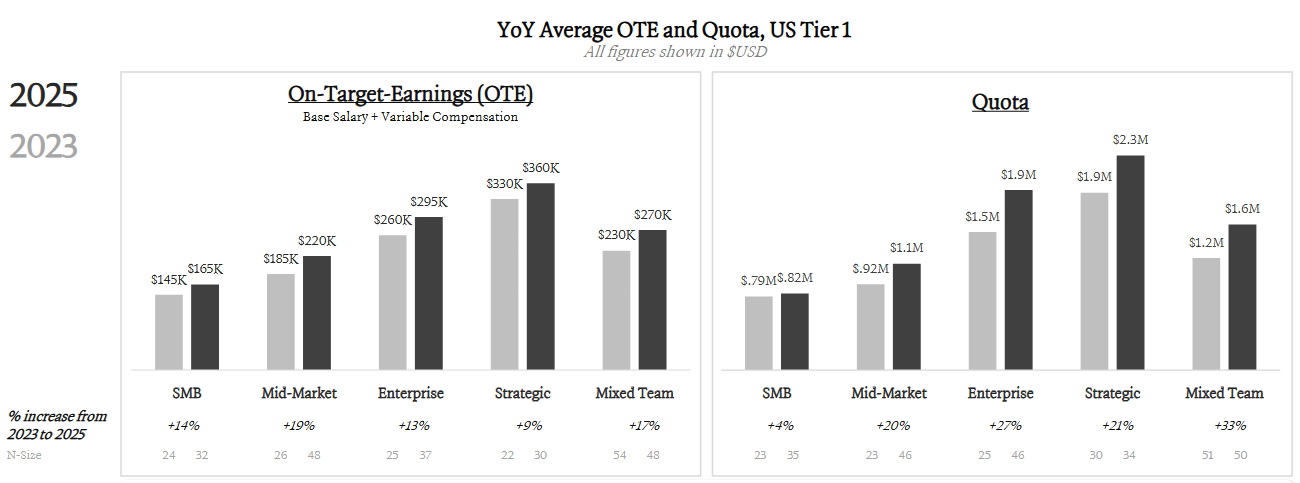
4. Sales Rep OTE
OTE = “on target earnings” is what a sales rep earns if they hit their sales targets at 100% (includes base salary + commission)
Below is the latest OTE split for AEs based on segment and ARR scale.
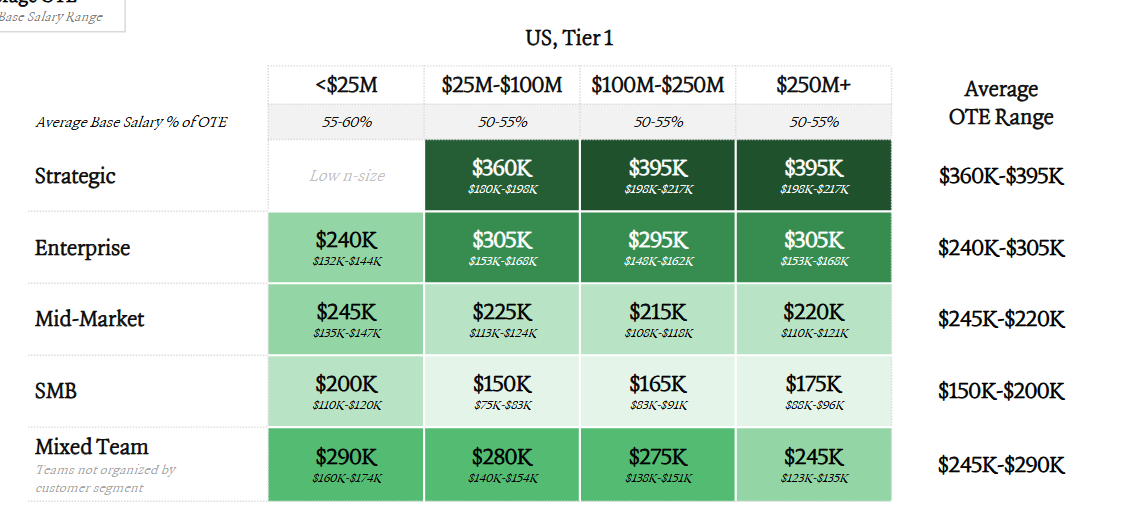
OTEs are still steadily increasing for sales reps (up between 9% and 19% over the past 2 years). But quotas have risen alongside them. Remember, a higher OTE but lower relative attainment still means worse efficiency!
💡Costly Mistake:
An important lesson I have learned is how costly it can be to hire reps for the wrong segment versus what you actually need).
A company thinks it needs an enterprise sales rep (so they pay the 25%+ premium for those reps) when in reality they are selling to mid-market. This means the OTE will be high but either 1) quotas will be too low or 2) attainment will be too low. Both of which means efficiency is really bad. The reps might be good, but it’s not what you need.
5. The GTM Pod & Headcount Ratios
Ultimately what matters is the lifetime value created versus the customer acquisition cost. In theory this is the perfect metric to evaluate efficiency, but VERY hard to accurately model.
Lifetime value = (lifespan in years) * (annual gross profit per customer)
The point isn’t to be extremely accurate. It’s to understand the drivers and assumptions. What must be true for my deals to make economic sense?
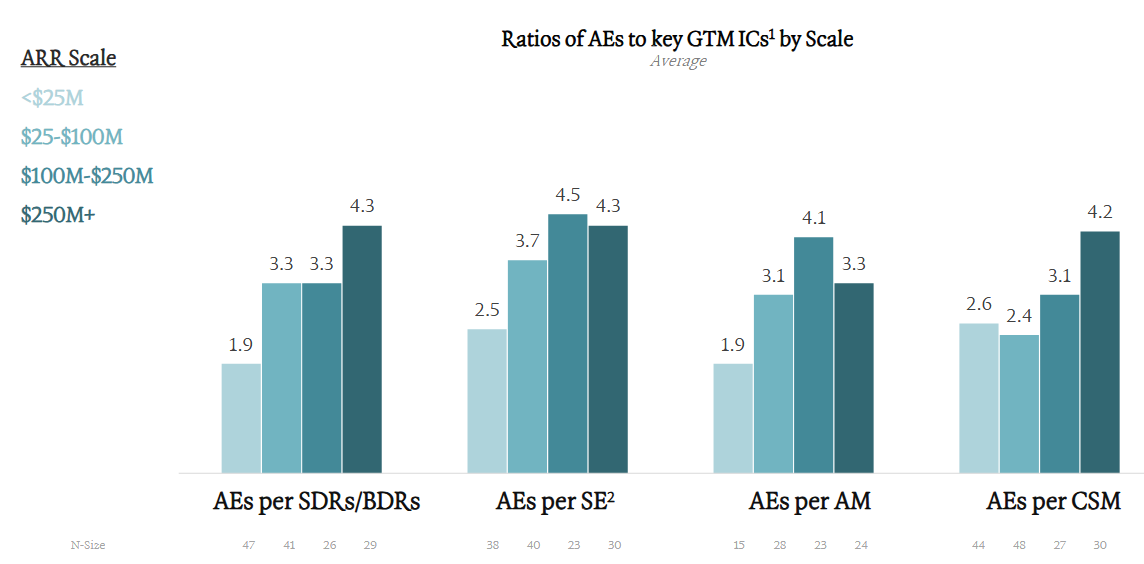
Deals aren’t closed by just the sales rep — they have a team behind them that make up the total acquisition costs (SDR, SE, CSM, marketing, etc). A GTM pod is all the headcount and spend that surrounds an individual Account Executive (AE).
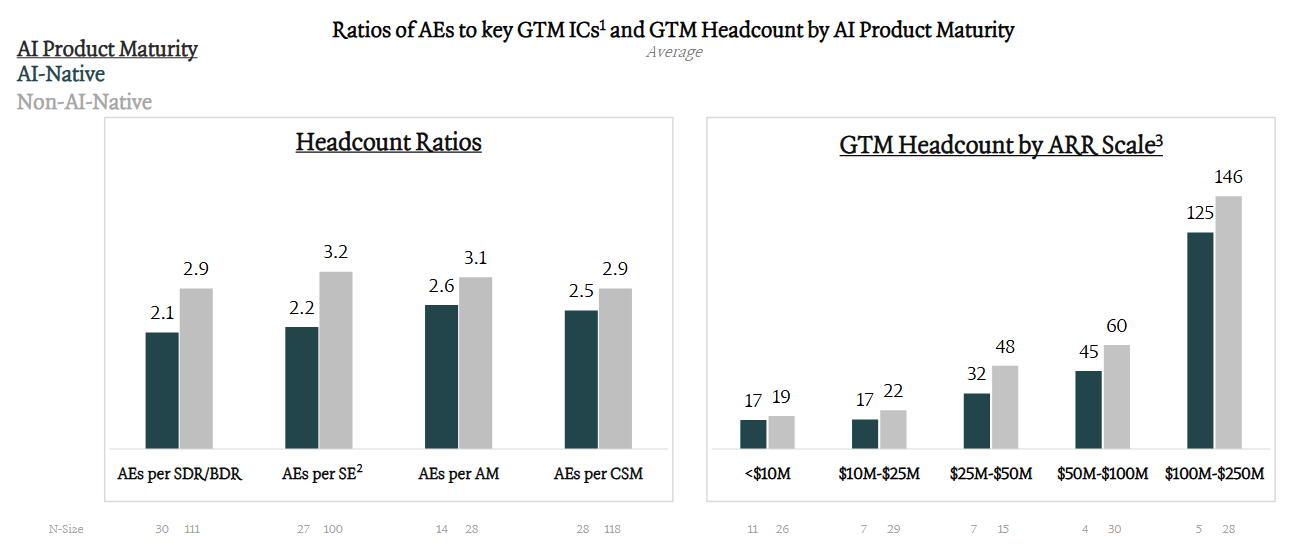
While these ratios improve as a company scales, savings are offset by more layers of management, ops, higher compensation, etc.
Make sure the total acquisitions cost makes sense relative to the expected lifetime value of the deal. You may be surprised about how bad some deals probably are…
Evaluating Sales Reps
Below are the key reports I make sure my head of sales is reviewing to evaluate sales rep efficiency. Make sure they have the data!
Attainment - how are reps doing against quota and peers?
Weighted discounting by sales rep - are reps excessively discounting to get deals done? This shrinks gross margins…Bad reps overuse discounting.
Pipeline coverage - do reps have sufficient pipeline to hit targets?
Pipeline source, self-generated vs other sources - are reps building their own pipeline? Especially if they don’t have sufficient pipeline
Stage conversion rates - are reps converting at expected rates (and compared to peers)?
Time to close - are reps taking too long to close deals? Or are they holding on to dead deals way too long to look busy?
Oppties per rep - how many deals are the rep working? Are they even busy?
New logo vs expansion - are sales reps living off of expansion or are they closing new stuff? You need them closing new logos for growth to be high.
Final Thoughts
2026 planning is already underway.
You need to start evaluating your sales rep (and broader GTM) efficiency now. Don’t just copy what you did last year or what the benchmarks say. Too much has changed for that to always be the right answer today.
Footnotes:
Get the playbook on how to save on popular vendors like: Slack, Hubspot, 1Password, ZoomInfo, and Gong (from Tropic)
I recently partnered with one of the best in-house tech lawyers I know to launch OnlyLawyer. Check out recent posts AI’s impact on contracts and how EU is making business difficult (again!)
As a SaaS sales leader, this is fantastic info that many companies fail to properly understand when establishing compensation plans