
Is ARR Growth Durable?
Revenue growth is already low, but it's even weaker than most folks realize
Today’s Sponsor: NetSuite

From supply chain shocks to cash shortfalls, today’s business risks can surface fast—and escalate faster. Blind spots, bad data, and aging systems only make things worse.
Download the C-Suite’s Risk Management Checklist —a quick, high-impact guide to help leaders get ahead of 8 critical risks in 2025.
Is Revenue Growth Durable?
All revenue growth is NOT created equal.
Many companies are getting quick, non-recurring (or less durable) ARR growth wins in 2025. While growth rates have already come down a lot, it’s even worse than most people realize…
A lot of operators/investors evaluate revenue growth as if it is all the same. I promise you it is not. The key is to understand the underlying drivers of revenue growth and what that means for its long-term durability.
Growth Endurance = the ratio of this year's growth rate to last year's growth rate
Segmenting growth rates by their durability is critical for both investors and operators.
Investors: This will help you better set valuations based on more realistic long-term growth expectations.
Operators: This helps you build more realistic forecasts and headcount plans.. I have seen many companies not fully appreciate the impact of non-durable revenue on next year’s revenue goals — sales targets are then set too high, too many reps are hired, and then budgets are too large. And what happens? Targets are missed and efficiency tanks!
“High Growth” in 2025
The investment bankers at Goldman Sachs released a Software Sector Update this month that had a few interesting slides on the macro environment.
The image below segments public companies by revenue growth rate buckets and FCF margins. Their top “high-growth” bucket is a pretty low bar — “>20% revenue growth”. High-growth isn’t what it used to be…

But this doesn’t tell the full story of how bad revenue growth rates have become. The true long-term revenue growth rate is breaking for lots of companies…
Spotting Non-Durable ARR Growth
Below is an example of the level of detail I like to see on the ARR waterfall for a larger company. And this can be further segmented by product, geography, etc as those become meaningful.
What’s important is that it breaks out the various increases/decreases that may have different growth durability characteristics. I also show the breakout of growth percentages by these same ARR types.

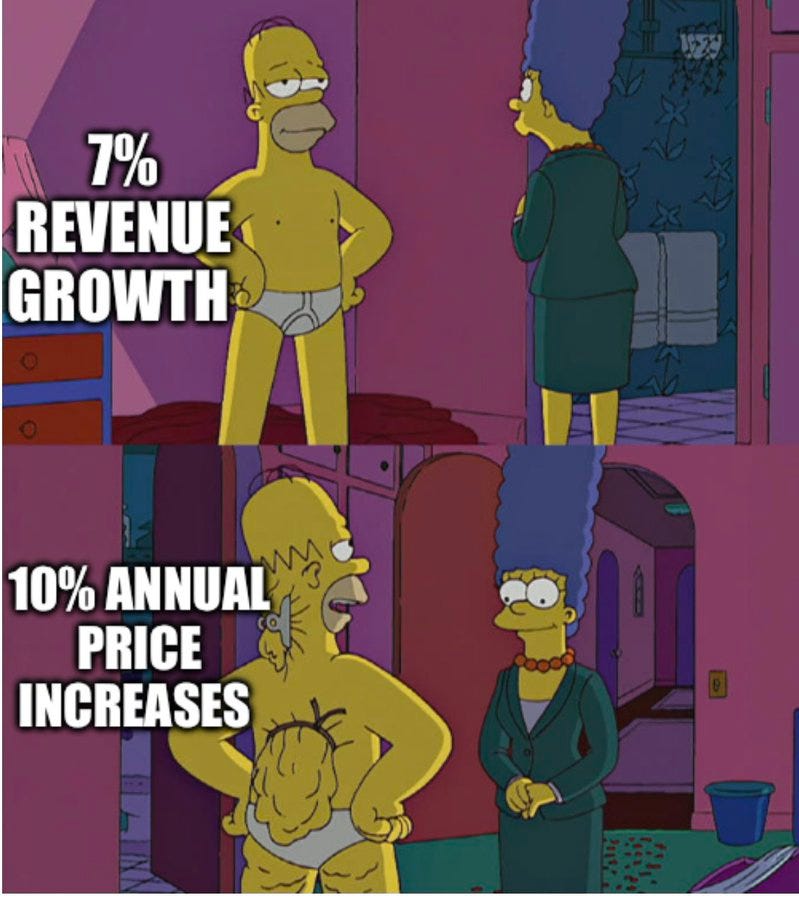
Price Increases: Big price increases are almost never durable. Software is becoming hyper competitive and you think you can raise prices annually by 10%?
New Product Release: Going multi-product is SO important in 2025, but it’s REALLY tough to get the same jump in revenue growth after each additional product release. Are you just selling more to existing customers or are you closing new logos as well?
Product M&A: Similar to the above point on new product releases
I want to know the growth rate in new logo ARR and what percentage of new ARR comes from new logos. This naturally decreases with scale as your overall growth rate declines. But a major YoY decline may indicate future growth troubles…

A good percentage split between new logo and everything else is primarily dependent on:
ARR scale — bigger companies with slower growth rates get more from expansion
GTM Motion — SLG or PLG, customer segment, etc can impact the timing of what comes in as “new logo” versus expansion.

Final Thoughts
Growth is way down in 2025, but it doesn’t even properly represent how bad revenue growth really is for many companies.
Companies can only hold revenue growth up with price increases, expansion, etc for so long….If new logo ARR growth is decelerating quickly then the durability of total revenue growth is already at risk.
Footnotes:
Check out Goldman Sachs Software Sector Update (June 2025)
Download the C-Suite’s Risk Management Checklist (from NetSuite)
Get 20% off with OnlyExperts to find offshore accounting resources