Lies of Customer Lifetime Value
High customer retention is the keystone of the SaaS business model
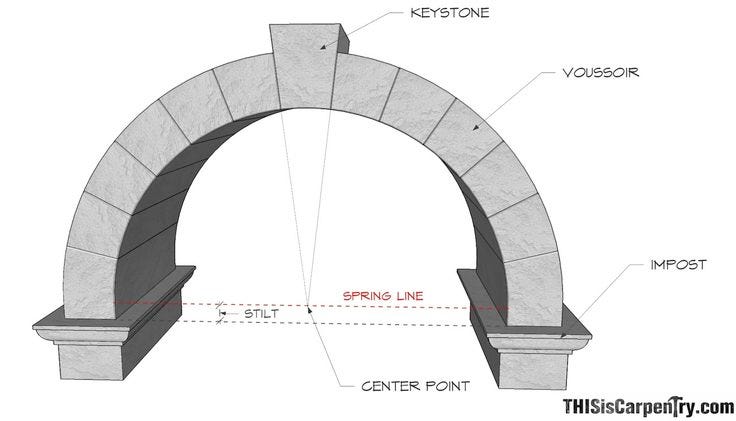
A SaaS company’s customer retention rate is like the keystone in the construction of an arch. The keystone is the wedge-shaped piece at the crown of an arch that locks the other pieces in place - without the keystone, the arch will crumble.
Similarly, the whole SaaS business model (particularly high-growth VC-backed companies) is built on an assumption of high customer retention rates. If customer churn is high (the inverse of high retention), then the keystone of the business model gets shaky and the whole thing is at risk of collapsing.
We tell ourselves lies about what our calculated customer churn rates imply about the potential lifetime value of customers. People need to understand the nuances of churn rates and how they can be a misleading indicator in the health of a SaaS business.
The way we analyze churn, the proliferation of SaaS tools, the explosion of AI, and the rapid decline of software development costs - all of these should impact how we think about churn and the lifetime value of a customer in the future.
*My focus is on enterprise SaaS, so I am using an assumption of annual contracts and larger ACVs (average contract value) below, but the same principles should apply across SaaS.
Importance of high customer retention
SaaS works because of its recurring revenue business model. A company spends a lot of money today to acquire a customer with the expectation that they will stay a customer for many years and the incremental cost of serving that customer is relatively minimal. This creates a lifetime value that is significantly higher than the cost to acquire and maintain so as a SaaS company starts to mature it becomes extremely profitable. The ratio most people talk about is at least a $3 lifetime value for every $1 of acquisition cost (i.e. LTV/CAC of 3+)
The below graph shows the range of burn multiples for VC-backed companies. The burn multiple is how many dollars of cash is spent to acquire $1 of net new ARR. For early-stage companies, this number can be quite high, with a median of $2.30 spent to acquire $1 ARR (per ICONIQ’s survey). It doesn’t take a math genius to know that isn’t sustainable if revenue isn’t recurring.
But it works IF customers stick around (customer retention is high) and the customers generate a high lifetime value…then magic happens. This is why the burn multiple trends down until eventually the company is profitable and can generate enormous profits at scale (that’s the expectation at least).
Customer Lifetime Value
The common method for calculating how long the average customer will continue to renew is 1 / churn rate.
Example: If a company has an annual churn rate of 10% then you might conclude that the customer life is 10 years (1 / 0.1)
I don’t have a problem with this calculation. But how are you determining the 10% churn rate? And I have a sneaking suspicion that the next 10 years will look very different than the last 10 years for SaaS.
Lifetime value = (lifespan in years) * (annual gross profit per customer)
Calculating Customer Churn Rates
At a high-level, churn rate is the percentage of your customers that terminate their service over a given period. There are two main churn rate calculations that I am going to cover:
A common iteration to the above calculations is determining what those churn rates are on an “available-to-renew” (ATR) basis. Available-to-renew takes into consideration different contract lengths and attempts to give an indication of how likely a customer is to churn assuming they have the ability to churn (i.e. contract is up for renewal)
Available-to-renew example: If a company has 100 customers at the beginning of the period and 10 of them churn, then under the simple churn rate calculation they have a 10% churn rate (or 90% retention rate).
But what if only 60 customers were available to renew because the other 40 signed multi-year contracts?
In this case, the available-to-renew churn rate is 16.7% (or 83.3% retention rate)
People often mistakenly assume that the ATR churn rate is somehow more real. It is an interesting data point, but there is a duration mismatch so comparing these churn rates with different contract lengths doesn’t make sense.
Dave Kellogg provided the below explanation on ATR-based churn rates:
In the example below, you can see that Company A has an available-to-renew-based (ATR-based) churn rate of 10%. Company B has a 27% ATR-based churn rate. So we can quickly conclude that Company A’s a winner, and Company B is a loser, right?
As you can see, in year 4 they are actually the exact same. But the 27% ATR-based churn rate is even better than the 10% rate because the lifetime value of “Company B Cohort” is greater since they didn’t have the option to churn in year 2 and year 3. Duration mismatching creates an issue that needs to be considered.
Only death is unavoidable
There are lots of reasons why customers churn, but I think most companies do a poor job of truly understanding why a customer leaves.
A Customer Success Manager (CSM) will hear a reason given for why a customer is churning and write it up in a churn analysis. But the initial reason given is usually not the root cause of the churn. You always need to double-click at least one more layer down (sometimes several) to really understand why a customer is churning.
The way people bucket churn also hides problems. Companies frequently talk about “unavoidable” and “avoidable” churn.
CSM: “Customer ABC has new requirements that we do not support so we are throwing this into the unavoidable churn bucket.”
The problem with the unavoidable churn bucket is that it usually gets ignored. Usually, the only true “unavoidable” churn is the death of the customer (i.e. goes out of business). All other types of churn are either regrettable or non-regrettable churn.
Regrettable churn: Lost customers within your ideal customer profile that are seeking outcomes that your solution should provide.
Non-regrettable churn: Lost customers because your solution doesn’t (or no longer) provide the right customer outcomes.
Non-regrettable churn should only be from a conscious decision to not solve for those desired customer outcomes. And this decision is a completely valid reason for churn.
Non-regrettable churn example: Quickbooks can be an amazing accounting tool for earlier-stage, less complex companies. It’s inexpensive, easy to implement, and easy to use.
When that small growth company becomes a more complex mature company though, Quickbooks may no longer be a viable solution so the customer churns.
Quickbooks isn’t trying to solve every use case because that would make it extremely complex and goes against its target audience’s desired outcomes.
But…over the years the ability of Quickbooks to scale with customers has grown thanks to the abundance of point solutions that can help solve some of the more complexity at scale.
The list of reasons for non-regrettable churn should be regularly reviewed because they will change - just like Quickbooks who can now scale further with companies thanks to all of its available integrations.
Churn isn’t linear
Amount of Churn History
Unless a company has adequate churn history they don’t know if there will be large stair steps of churn.
Let’s take a hypothetical Quickbooks example. Let’s say in the early days that Quickbooks did an amazing job selling to their target customer (small businesses). For the first 3 years of Quickbook’s business, the customer churn is amazingly low at 5% annual churn - they have only lost a few customers because they went out of business.
Does this 5% churn mean that on average customers will stay for 20 years (1/0.05)?
Likely not….the length of churn history is inadequate to capture what happens to that original cohort of customers. What if after the original 3 years there is a stair step in churn as a lot of customers become more complex and outgrow Quickbooks? If that happens then churn will start to increase a lot.
Churn Cohort Analysis
Continuing the example above, if Quickbooks was growing very quickly, then a large increase in churn in year 4 could be misrepresented if you only look at simple total churn rates.
In our assumption of a large stair step of churn in year 4, we fail to capture the true economic impact of the step-up because high growth softens the real churn problem.
As seen below, yearly churn is 5% for the first few years, but then churn explodes to 15% on a simple total basis (churn $ in year 4 / ARR at the beginning of the year).
What this analysis doesn’t capture is that most of the year 4 churn is due to the year 1 cohort of customers and all of the year 1 customers have now completely churned.
So what just happened?
For the first 3 years we assumed we had a 20-year customer life, but now in year 4 the same calculation shows we have a customer life of 6.7 years.
Still pretty good, right?
But wait….we just said all year 1 new customers churned by the end of year 4 🤔, so doesn’t the average customer life have to be less than 4 years? You are almost doubling the lifetime value by looking only at a simple total churn rate!
Looking at churn rates on a total basis can be misleading, especially when growth is high. Looking a customer cohorts will help capture any potential stair steps of churn as long as you have enough historical data.
This also isn’t just an early-stage company problem. These churn stair steps can happen to more mature companies as they release new products, enter new customer segments, etc.
Rate of technological change and competition
In the early days of Salesforce, a customer life expectation of 15 years with little ongoing customer cost may have made sense. Competition was light and building something like Salesforce was extremely hard.
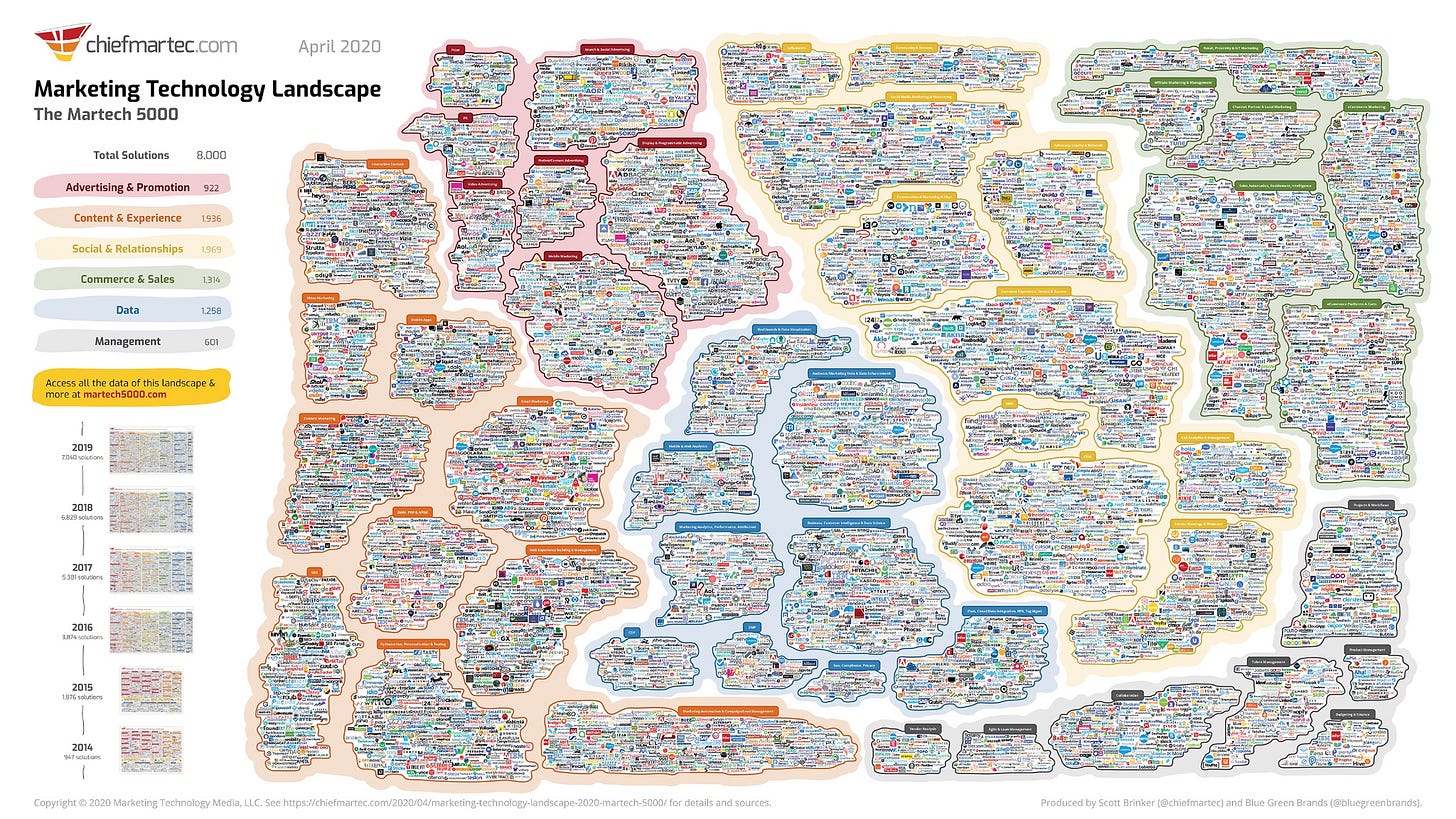
The below chart on the marketing tool landscape is from 3 years and it is still crazy to see the volume of just marketing vendors out there. It’s much bigger today and is only increasing at a faster clip.
It’s a different world in 2023 and will certainly be different over the next 10 years. Continued innovation (such as AI) has brought the cost of development down significantly. Competition has exploded and will grow exponentially now with AI.
The combination of the above factors will likely drive higher churn and/or margin compression in the future. Higher churn because of the abundance of choice and vendors who don’t continue to innovate will be replaced. Margin compression as a result of higher competition with people finding ways to continue to lower sales prices.
Historical benchmarks of retention/churn are likely not the best indicator for the next 10 years.
Concluding Thoughts
While I can’t predict the future, I have a sneaking suspicion that our historical churn rates aren’t going to be the best predictor of future rates. Too many companies have been tricking themselves about what their current churn rates imply about their customer lifetime values and unit economics.
Given the macroeconomic environment, companies are already putting a stronger emphasis on efficiency. But I don’t think it’s enough for most companies. Companies also need to further de-risk their bets by lowering their CAC payback period and ensuring other metrics are even more efficient than before.


As a CS guy, this is really helpful context and analysis. Learned more here than I did in undergrad!
Really impressed with your content. We clearly share many, many opinions!