
Monday.com Deep-Dive | Power of Efficiency
Lessons from Monday.com on efficiency, growth, and valuations.
Monday.com is a unique company for many reasons, but one of the most important is how efficiently they have grown and the speed they have become free cash flow positive when growth slowed. Every software company is trying to answer the same question — how can we grow more efficiently? Growing more efficiently means more cash to invest, longer cash runway, and more shareholder value.
Outline of Article on Monday.com:
Value of Gross Margins
Understanding Gross Margins
Understanding COGS
Monday.com’s Gross Margins
Free Cash Flow
Rule of 40 Score
Thoughts on Monday.com
Other Charts & Stuff
Value of Gross Margins
Not every dollar of revenue is created equal and gross margin is the primary suspect. During the boom times of 2021 investors valued companies almost solely based on revenue without regard to gross margins or any other costs.
Ultimately the value of a company is driven by its ability to generate free cash flow to shareholders over the life of the business. Gross margin is the most significant piece of the potential free cash flow equation.
A company with 70% gross margins has to have 30% higher revenue than a company with 90% gross margins in order to generate the same free cash flow (assuming all other expenses are equal).
The example below shows a company growing 30% each year (blue bar) and the gross profit generated at 90% gross margins, while the orange bar is the amount of revenue required for a company with 70% gross margins to generate the same profit. By year 5 the 90% gross margin company needs only $371M in revenue while the 70% gross margin company needs $477M in revenue to generate the same profit.

Understanding Gross Margins
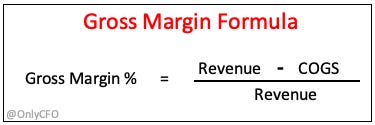
Gross margins tell you how much (either as a $ or % of revenue) profit you have after subtracting cost of sales (aka COGS) from revenue. In the formula below, we can see gross margin expressed as a percentage of revenue. Viewing gross margin as a percentage of revenue is generally more useful because then it is comparable across benchmarks and other companies.
COGS is a very protected financial expense group because investors focus on it due to the free cash flow implications. Ultimately though, gross margin is just an indicator of free cash flow potential. If a company just does some accounting trickery and puts more costs in OpEx then even though gross margins will look better, profit potential is the same. Many investors, especially early stage investors where COGS is often wrong, have been fooled by this.
What gets included in COGS?
The major categories included:
Customer hosting costs - AWS, GCP, Azure, etc
Support team - responding to customer support tickets
Dev Ops - people ensuring uptime and reliability of accounts
Software and other costs for the teams above
MAYBE customer success - see below
Most software companies are fairly consistent with these groupings with a few exceptions:
Early-stage companies are usually bad at properly breaking things out and allocating the right things to COGS (COGS is almost always understated). I almost never trust COGS for companies less than $20M ARR and a built-out accounting team.
Customer Success: There is a lot of accounting diversity on whether this customer success lives in COGS or S&M (or split between the two). Companies have to determine what their customer success team is actually doing to determine where it should be recorded on the income statement, but there will always be an element of judgment.
Investors need to make sure they understand what is being included/excluded in COGS so they can make informed decisions when comparing it to other companies.
Monday.com’s Gross Margins?
Monday.com has the 3rd highest gross margins of all public cloud companies with a gross margin of 89%. The average gross margin is 74%, so Monday.com automatically has 15 percentage point advantage to the average cloud company. As I illustrated earlier, that means the average cloud company must grow ~30% faster than Monday to generate the same amount of profits.

What’s interesting is that the companies with the highest gross margins are generally not receiving top valuation multiples. The second column in the image above shows the revenue multiple (enterprise value / revenue). Most of these companies aren’t even in the top 20 (out of ~80 companies).
If gross margin is so important, why aren’t they receiving top valuation multiples?
Revenue Growth: Faster growth can easily beat better gross margins to generate more profits. The top 10 revenue multiple companies are expected to grow 23% next year on average while the top gross margin companies are growing ~15% on average next year.

In the below chart I take two hypothetical companies to simulate the average of the top 10 gross margin companies vs the top 10 revenue multiple companies:
87% gross margin (GM) company that is growing at 15% each year for the next 5 years
77% gross margin (GM) company that is growing at 23% each year for the next 5 years.

While the gross profit (revenue - COGS) is higher in the first year, the faster revenue growers (just 8 percentage points faster) catch up in just one year. The high growth companies then go on to generate significantly higher profits than the slower growers with higher gross margins.
There are obviously some assumptions baked in here, but all else being equal, a faster long-term growth can be significantly more valuable than a slightly higher gross margin.
But….it is never that simple. Higher-growth rates may be temporary. The higher growth rates need to be fairly sustainable compared to the companies with high gross margins for it to be better.
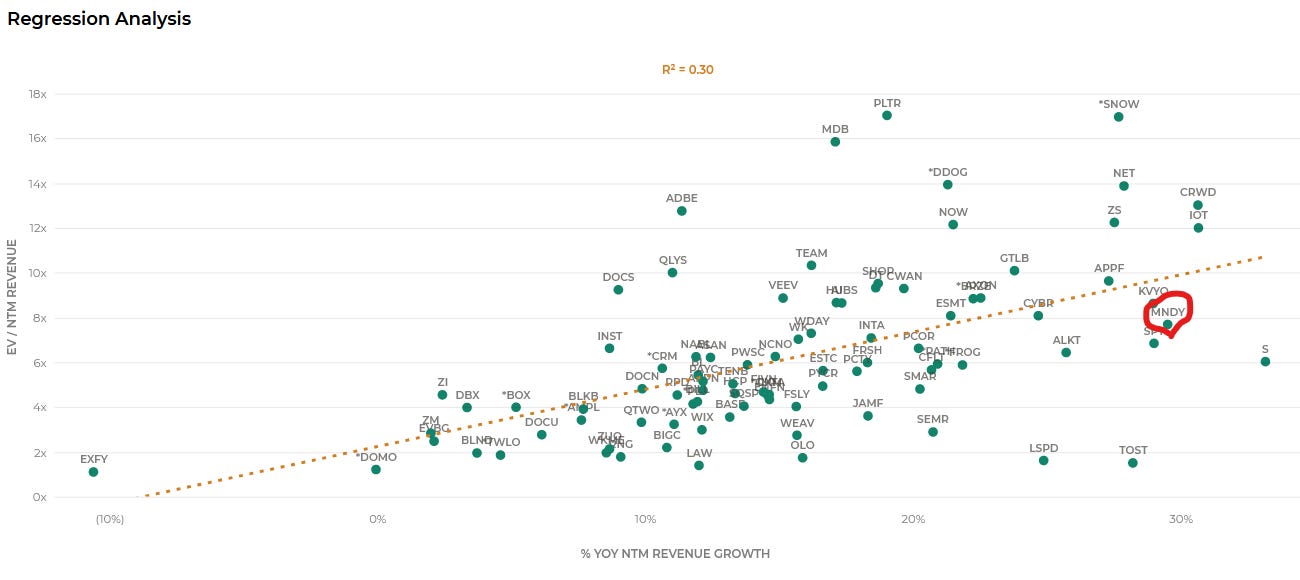
The below chart shows the correlation beween revenue growth and revenue multiples. Monday.com is one of the fastest growers at a relatively lower valuation.
Free Cash Flow
As I mentioned earlier, gross margins are important because they set a ceiling on how profitable a company can become. But COGS are not the only expense and what ultimately matters is a company’s ability to generate cash for shareholders.
Some companies are able to build strategic advantages in the other areas of the business, primarily with research & development (R&D) and sales & marketing (S&M), by making these incredibly more efficient than the competition.
How do the high gross margin companies do in terms of free cash flow (FCF)?
Four of the top 11 FCF margin companies are on the list for top 10 gross margins. I included 11 here to include Monday…It makes sense that there is a pretty good overlap between these two lists.

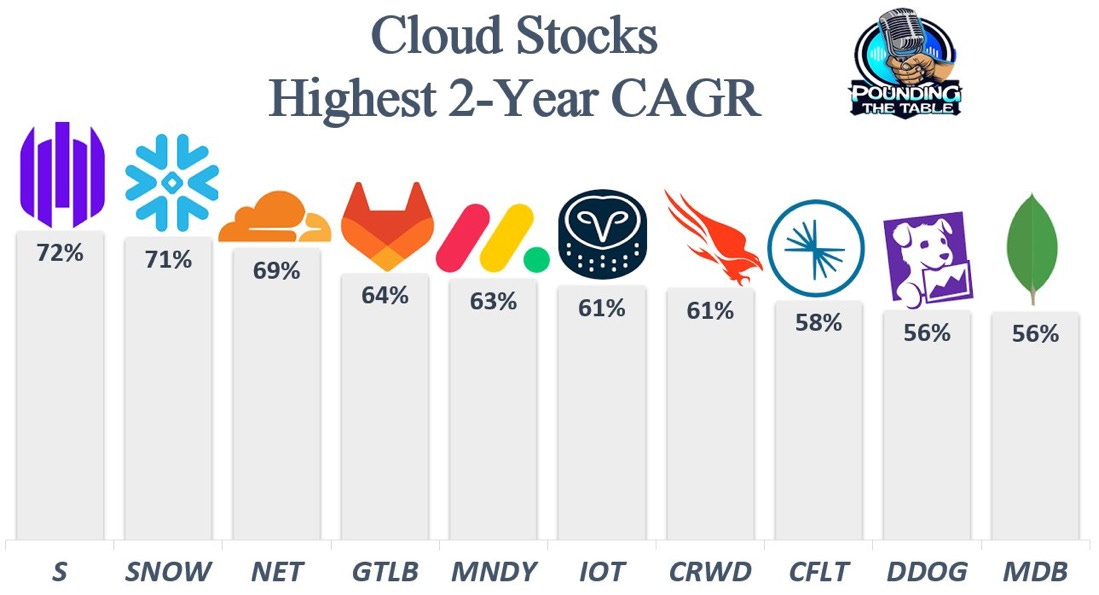
The other companies on this list are generally fairly large, more mature companies so they have optimized free cash flow a lot more. Notice that Monday.com is the fastest revenue grower on this list for the last twelve months and the second fastest for the next twelve months — just under Crowdstrike which has one of the highest revenue multiples.
As illustrated earlier, faster long-term growth can easily outweigh current profitability.
Rule of 40
The Rule of 40 score is a metric that looks at how a company balances revenue growth with profitability. There are a few ways to calculate but I am using the following:
Rule of 40 Score = Revenue growth + FCF margin
Monday.com is ranked #8 of all public cloud companies for its rule of 40 score. Given the impact of revenue growth many people like to add more weight to revenue growth versus FCF margins when calculating the Rule of 40 score. I bring that up because Monday.com has the second highest revenue growth expectations over the next 12 months of this group.

Despite its high growth and impressive profitability, Monday.com has the lowest revenue multiple rank of this group. Monday.com is expected to be the 5th highest revenue grower over the next two years.
Why aren’t investors giving Monday.com a higher revenue multiple then?
Maybe they think longer-term growth rates are better with the other companies?
Maybe they think Monday.com can’t become as profitable as the other companies?
Ultimately, it has to be one of the above two answers….Or there is an opportunity at the current stock price levels.
The below chart shows the correlation between the Rule of 40 Score and revenue multiples. Monday.com sticks out on this chart for having one of the best Rule of 40 Scores but having a much lower relative revenue multiple than other companies around it.

Thoughts on Monday.com
Monday.com is an interesting company from a financial perspective. It has grown incredibly efficiently and is still one of the fastest growing software companies for its size. Based on a lot of the financial data I presented above, it appears as if it could be undervalued. The point of my article is to not give buy/sell recomendations of stocks, but to educate. The reason Monday.com appears undervalued relative to other software companies must be because of:
Investors think longer term revenue growth is not as good relative to others. Investors would have to assume it’s long-term revenue growth after 2 years will be bad since consensus estimates over the next two years show that it is expected to be one of the fastest growers.
Investors don’t think Monday.com can be as profitable at scale as other companies. While it appears like Monday.com can be incredible profitable based on how efficiently it has grown and how quick it got to a high FCF margin, investors may think those profits aren’t sustainable.
The third option is that Monday.com is actually undervalued relative to other software companies since the ultimate value of a company is based on its ability to generate cash for shareholders — revenue growth and FCF margins are the key components of that.
Other Interesting Facts
70% of their customers are non-tech. Not being highly concentrated in tech makes their existing revenue less risky and their ability to have continued high growth more probably.
51% of revenue is international, which is much higher than the typical software company at its stage
Monday.com is Israel’s most successful software company. 7% of the total workforce has been called up for reserve duty recently to do the current war and Israel customers account for low single-digit % of ARR. This is obviously a current risk for Monday.com. It may mean that Monday.com becomes a bit less efficient temporarily. If that happens the stock may take a short-term hit, which could be an opportunity if longer-term it shows strong profitability.
Other Charts and Stuff
Happy 2-year anniversary of the peak of the cloud bubble to all those who celebrate. From a 20x average revenue multiple to a 5.5x revenue multiple today.

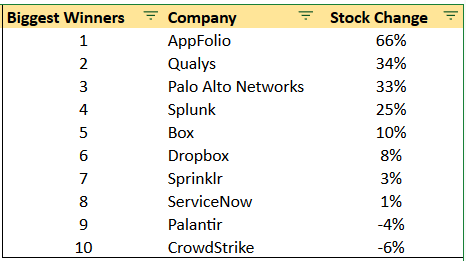
There are only 8 public cloud companies (out of ~80) that have positive stock returns since the November 2021 peak. Most of these companies are the more boring public cloud stocks…
On the other side…here are the biggest losers since the peak. Some of these companies were expected to be huge winners back in 2021…

***Author may own positions in securities discussed. Nothing in this article should be considered investment, tax, or legal advice. Do your own diligence.
I can remember about 12-18 months ago when SaaS stocks were bottoming, and several prominent posters on Fintwit declared that all of the project/work management SaaS companies were "no-moat shitco's". Interesting that although that was the bear thesis, very few were thinking through the bull thesis, which was that these companies (or at least the stronger ones) were on their way to being mini-Atlassians.
The charts on gross margin vs revenue growth over time are 🔥. Really drive the point home. Keep up the examples