
Praying for Distribution | AI Changes the Math
The 3 ways distribution spend shows up on the P&L
Today’s Sponsor: Deel

For finance leaders, managing international payroll and compliance requires expertise. Our ‘Guide to EOR for Startups’ offers a detailed look at efficient global payroll management & compliance. This guide will help you:
Manage cross-border payroll easily
Navigate tax implications across jurisdictions
Reduce financial risks associated with global growth
Take control of your financial strategy today.
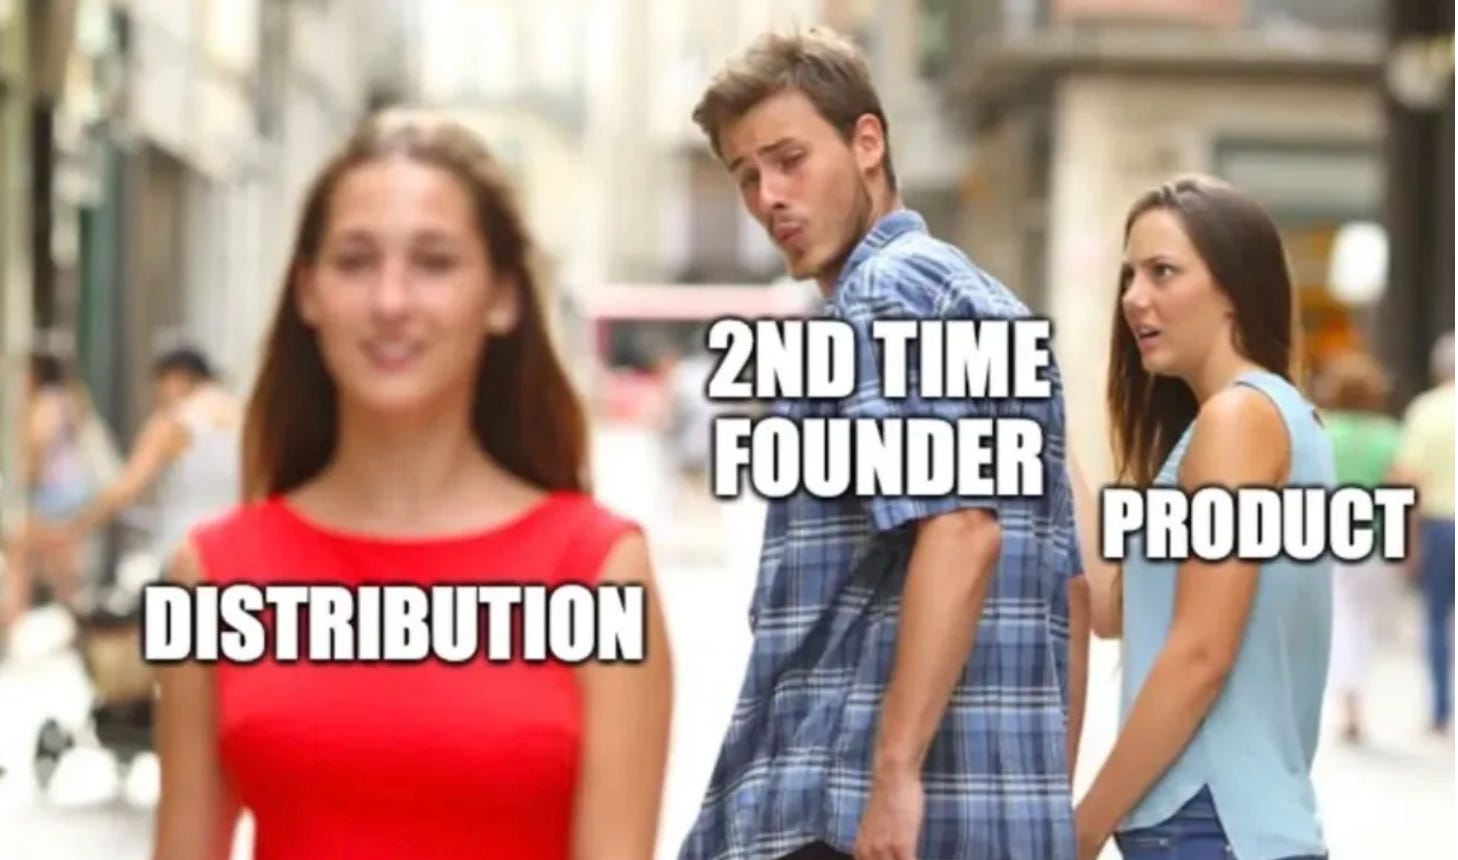
Distribution > Product
Founders embark on a journey to change the world with their amazing new software/AI tool only to realize that their job is actually to build a distribution engine.
The best product doesn’t always win. Yes, the product needs to be good, but a great product is table stakes in 2026. It’s all about distribution.
Where Distribution May Live on the P&L
There are four places on a P&L where companies can spend their money. Three of them (not G&A) are areas where distribution spend may actually live. Distribution doesn’t just live in sales & marketing anymore…
There isn’t one right answer, but companies have to find their distribution/product fit - where distribution spend is most valuable for their product. You can’t do all of them. Well, you can try but unit economics will be broken and you will run out of cash real quick.
1. COGS: Inference as Distribution
COGS is the new CAC for many AI companies.
Inference costs are so high for many AI products that they eat a significant amount of gross margins. Companies like Cursor, Lovable, Replit, etc are treating inference costs as the new marketing budget.
The long-standing advice has been that lower gross margins means a smaller revenue multiple. Why? Because gross margins represent the “ceiling on profitability”. If your ceiling is lower, it will be harder to create a cash cow at scale.
This is true if nothing else changes, but what if S&M decreases by the same amount that COGS increases? In other words, what if your inference costs are your distribution? Companies like Cursor have zero S&M team and very little spend.
Where companies get in trouble is spending high in both places (high inference + high S&M). Your unit economics won’t work if both are high. You must choose your distribution. High S&M costs only work if gross margins are 75%+.
2. R&D: The Product Flywheel
Some companies focus on using R&D as a distribution engine through creating a product that “sells itself”. R&D has to build a flywheel into the product to enable self-serve and bottoms-up adoptions.
Atlassian is a classic PLG company. It spends 2.3x more on R&D than S&M (52% on R&D and just 23% on S&M).
Many PLG companies don’t manage total distribution spend very well though. They end up spending more across the sum of R&D and S&M than their SLG (sales-led growth) friends. The “more efficient” PLG selling motion is not real….they just sneak distribution expenses into R&D.
CFOs (with their CMO) need to watch the total spend and not just focus on S&M since distribution spend can show up in other places.
3. S&M: The Traditional GTM Model
A lot of companies are keeping distribution in the traditional place (S&M), but there are certainly shifts in where budget dollars are being spent in 2026.
A lot of marketing experiments are happening to capture eyeballs in 2026 and I think a lot of it has pretty bad ROI…CFOs need to pay close attention and force CMO to somehow measure distribution success.
Distribution > Product Benchmarks
Below are the top 10 fastest growing public software companies. On average, they spend 1.6x more on S&M than they do R&D.
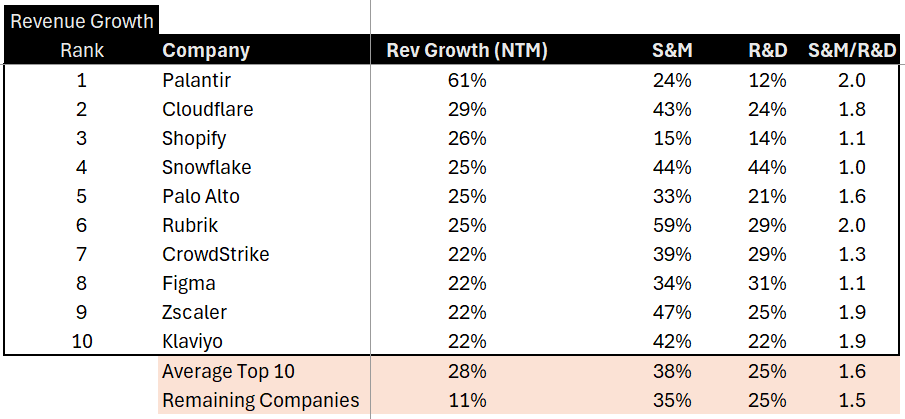
And you thought you were building a company to make cool tech?
Most exec team time and board discussions are about distribution. Product is <20% of our time.
While none of these public companies are really using COGS as distribution (that’s a new AI startup thing), many of them have a PLG (or hybrid) selling motion so a portion of their R&D spend effectively functions as distribution. This means that even more than 1.6x is actually being spent on distribution than innovation.
Acquisition Costs Are Rising
Look back at the “remaining companies” line from the above chart. This is the average of all public software companies not including the top 10 fastest growing companies. This group is only growing 11%, but has basically the same spend ratios. They are spending the same amount to get 40% of the revenue growth…significantly less efficient.
S&M spend can be sticky even as revenue growth falls.
CAC payback periods are near the highest level they have ever been with a 20-month median payback period.
CAC payback period: (LTM S&M) / (LTM Net New ARR x Gross Margin) x 12
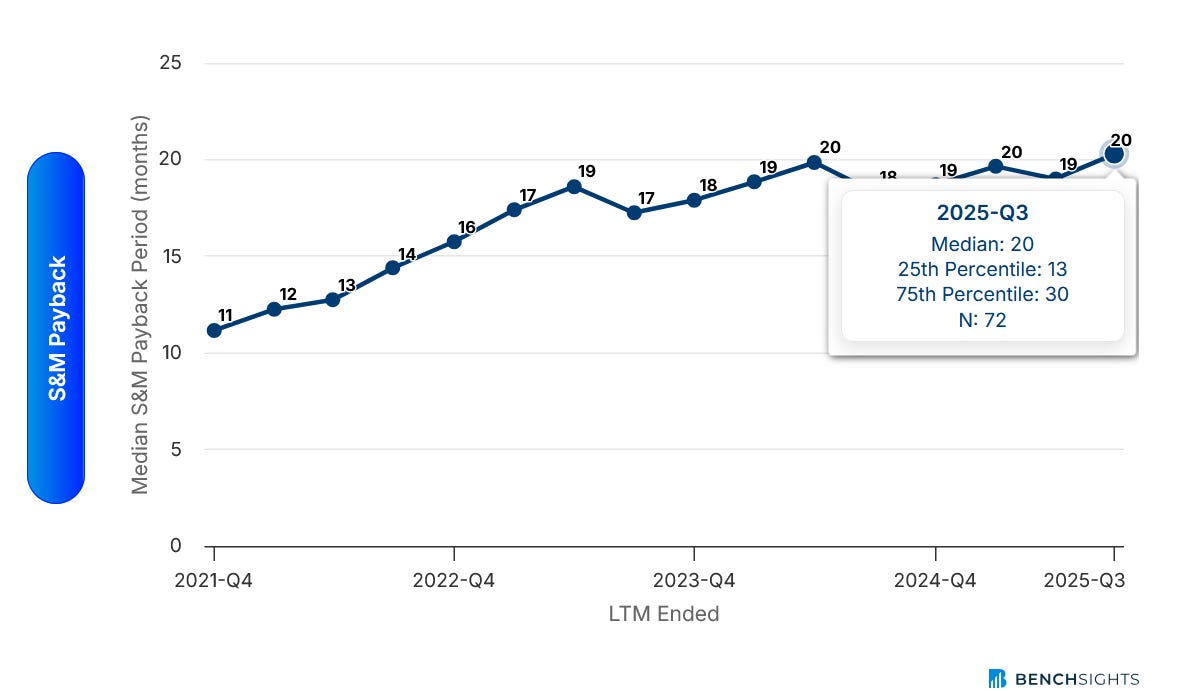
These rising CAC payback periods are adding fuel to the fire for lower software multiples. Software has an increasingly uncertain future so investors are discounting future free cash flow more. If it now takes 20 months just to payback acquisition costs (versus 11 months a few years ago) then those future cash flows are being punished.
CFOs must focus on reducing CAC payback periods in 2026. It should be one of the top goals.
NRR is Falling
One of the main culprits behind rising acquisition costs is the drop in NRR. While a bottom may be forming, NRR has decreased a lot over the same time period. Expansion revenue is usually ~1/3 of the cost of new customer revenue. So companies lost 10% of revenue growth (the drop in NRR) from a significantly cheaper revenue source. That hurts GTM efficiency.

Final Thoughts
The cost of building a product might be falling because of AI, but the cost of distribution is rising because attention is harder to get.
The role of the CMO (in partnership with the CFO) has never been more important because getting distribution right has never been more critical.
Pro Tip for 2026: Lower your CAC payback period today. Whatever it is now, it needs to be lower.
Footnotes:
Download this EOR guide from Deel. It’s a great guide that every company looking to expand internationally should read.
Want to Sponsor? I am opening up the rest of the year now so email me at onlycfo@onlycfo.io to secure a spot.
Thank you for helping CFOs keep pace with what’s happening and how to navigate our companies to higher ground.
As someone else said, this might just be your best post yet!
This may be your best post. So well described. So many of us are scratching our heads right now about this stuff.
We’ve had PLG and SLG. Maybe we need a new term now: TLG? Token-led growth? Of course it’s not just tokens alone. They have to be doing good/smart/valuable things. The problem for the economic model of course is that the tokens have to keep coming for the users. It’s not just CAC that — once the buyer is buying, no longer keep causing the vendor costs. Nope. - instead the tokens will keep flowing, bringing down the margins of the recurring payments. To analyze the economics correctly, you have to factor in the lower recurring margins. Ideally over time the pricing model can help out. But most vendors are flailing with that still. For good reason. Things are moving so fast!