
💀The NRR Death Spiral
What is a "good" NRR? LOTS of companies are already in (or are quickly approaching) a "NRR Death Spiral"📉
Today’s Sponsor: NetSuite
In this guide, Ed Wallace, Managing Director, Achieve NEXT, shares a framework for relationship building based on his book, The Relationship Engine, and discusses how it can be applied to that most critical and contentious of relationship—the CFO and sales leaders.
Sign up for the OnlyCFO webinar series! Our next webinar is on February 19th on the M&A environment in 2025. Our panelists include the founder of Spiff (who sold to Salesforce) and a popular PE software investor.

The slowdown in software sales over the past few years has put LOTS of companies in a “NRR Death Spiral”.
NRR (net revenue retention) has dropped to such a low level for many companies that their unit economics are broken and things are starting to spin out of control.
And most companies don’t even realize they are in a death spiral until it’s too late…
As a refresher, below is how NRR is calculated.
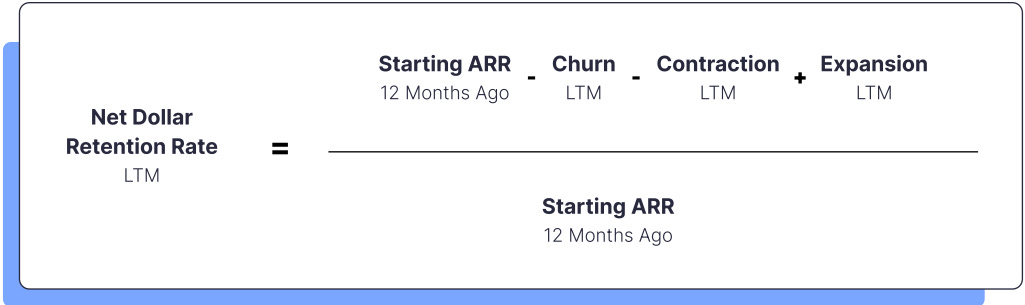
Most leaders/investors don’t understand what “good” NRR actually means relative to their circumstances. A good NRR at one company might be bad at another…
And a small change in NRR can have a major impact on a company’s potential.
The NRR Death Spiral
What NRR benchmarks should I target?
Lots of people talk about what “good, better, best” NRR metrics looks like, but they fail to qualify in what circumstances these targets should apply. People hear something like the below and blindly apply these as good targets for their company.

However…there are too many variables for the above benchmarks to be universally good advice. But people often talk about NRR as if all companies should follow the same targets.
Some variables that may impact NRR:
Customer Segment - SMB and mid-market customers churn more and expand less.
Stage of Company - The larger the company the harder to keep NRR high.
GTM Motion - Smaller initial deals means higher potential NRR
NRR Trend - The speed and rate of NRR changes can reveal a lot.
For example, a rapid decline may mean you are falling out of PMF. This can be true even if you are currently above a typical “good” benchmark.
What determines a “good” NRR is also relative to your GTM efficiency. The lower the customer acquisition cost, the lower the acceptable NRR.
For example, selling to the SMB segment typically means you will have more churn and less expansion (therefore smaller NRR). That is perfectly OK if paired with the right GTM efficiency. In the SMB segment you need shorter sales cycles and much smaller acquisition costs for the money math to work.
What is an acceptable NRR" based on my circumstances?
All else being equal we want higher NRR. But you need to think of it relative to your customer acquisition costs to understand what it means for your unit economics. A LOT of leaders don’t get this.
Higher CAC = Higher NRR required
Lower CAC = Lower NRR required
If you are a VC-backed company then the expectation is that you can get to 20%+ FCF margins. If your NRR is too low relative to the cost to acquire a customer, then you will never get to those juicy 20%+ FCF margins.
What does a low and/or declining NRR reveal?
Losing product market fit (PMF)
Increased competition
Pricing pressure (I think many will face this in 2025)
Bad pricing model (expansion is hard based on the model)
Failed to “stack S curves”. In other words, the company hasn’t been able to figure out new levers of customer expansion.
Double Edge Sword
NRR is strongly correlated with GTM efficiency, especially when the change in NRR is quick.
Declining NRR = weakening GTM efficiency
Increasing NRR = Strengthening GTM efficiency
It is a lot cheaper to retain and/or expand existing customers than it is to acquire another customer. And when NRR changes fast, it often means something is really working well (if increasing) OR is very broken (if decreasing).
Let’s look at the NRR of public companies compared to their GTM efficiency ratios below.
Median NRR since 2020
NRR has been in a steady decline since early 2022. But on the bright side…NRR seems to have bottomed out around 110%.

GTM efficiency since 2021
The chart below tells us how many dollars it takes to acquire $1 of ARR.
And as you can see, customer acquisition costs have skyrocketed over the same period that NRR has fallen.
Declining NRR, over hiring, and decreases in revenue growth have all contributed to rapidly decreasing GTM efficiency.

NRR Trends
Below are a couple of other good charts on NRR.
But…they are useless if you don’t understand the firmographics of the benchmark data and if they are comparable to your company.
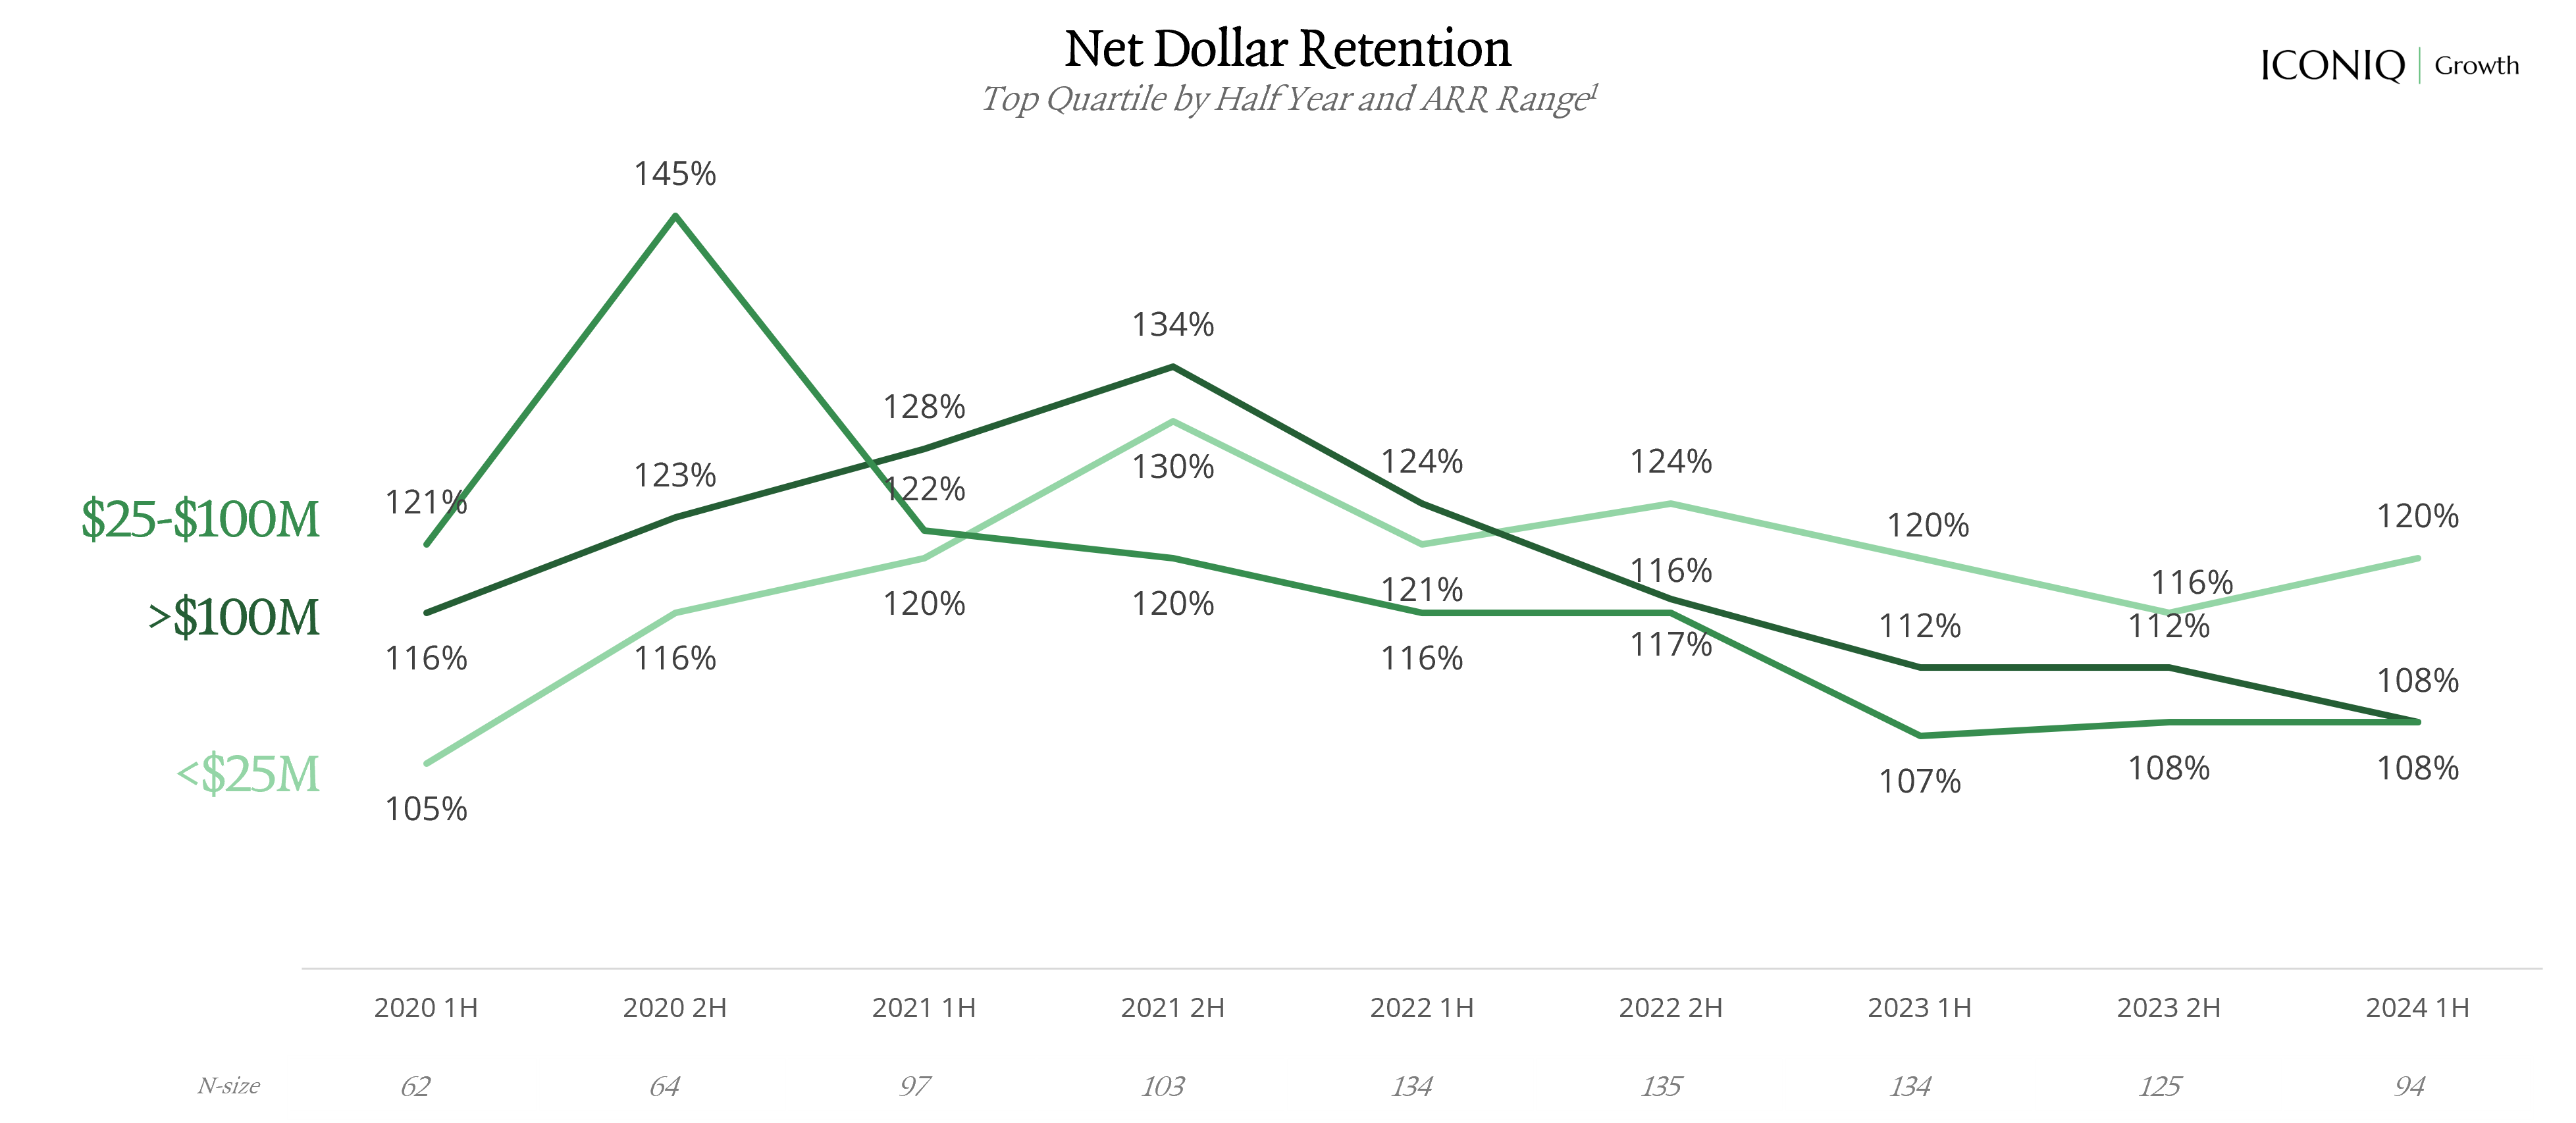
For example, the chart below is NRR from ICONIQ (a VC firm). ICONIQ is a top-tier firm that has some of the very best companies in their portfolio with heavy weighting in B2B enterprise software. Based on that, you should expect relatively high NRR in their data.
The NRR benchmark data below is from Benchmarkit. They have a lot of small to mid-sized companies that might be bootstrapped, VC backed, or PE backed. Given their much larger mix of participants in the data I would expect the NRR benchmarks to be lower and to have a pretty large range.

Two different benchmark reports on NRR with significant differences based on the firmographics of the companies in the data.
Summary
Evaluate NRR relative to your GTM efficiency.
Benchmarks can be dangerous. Make sure they are comparable to your company.
If lower NRR is here to stay for your company, then you must adjust GTM and other spend accordingly. Maybe AI efficiencies can save us from sticky low NRR?
Don’t look at metrics in isolation. Evaluate metrics in relation to each other.
Footnotes:
Check out → CFO’s Guide to C-Suite Relationships
Sign up for the OnlyCFO webinar series! Our next webinar is on February 19th on the M&A environment in 2025.

Check out OnlyExperts to find offshore accounting resources. They have some amazing talent for 20% the cost of a U.S. hire
Your insights serve as a reminder that whenever NDR dips, we must pinpoint whether it’s driven by churn or a drop in ticket sizes. Without making that distinction, we risk missing the real issue.
For NRR calculation, you should only consider Expansion, Contraction, and Churn for the same client base, right? Based on your formula, it seems you are also including clients added in the middle of the year, which could impact Expansion and Churn but were not included in the denominator.