*Disclaimer: This is not investment advice. The author may hold positions in securities discussed.
This is a story of a stock that saw its revenue valuation multiple drop by 97% from the peak. No, I am not talking about one of Chamath’s SPACs….I am talking about Zoom.
Zoom is one of the most recognized software brands in the world. The global pandemic was a major accelerator for Zoom that sent a significant part of the world’s workforce remote almost overnight in 2020. Businesses, families, schools, churches, friends, etc also all adopted Zoom when they could no longer connect in person.
Zoom became a top beneficiary of the pandemic (and they also helped a lot of people with free Zoom access as well).
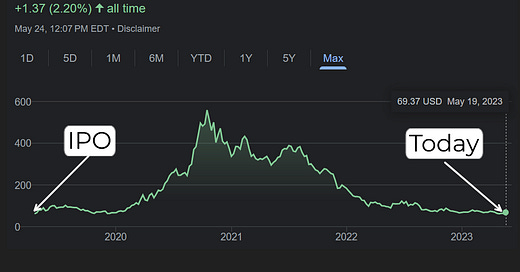
If you bought stock on the day of the IPO and sold at the perfect time in 2020 then you would have made a nice 900% gain in a little over a year. But…if held it through this week, you would have made about 2% over the past 4 years…
Read on to learn about Zoom’s wild valuation ride.
Understanding Valuations
There is some terms and definitions you should understand when it comes to a company’s “valuation”.
Market capitalization (aka as market cap): is the total value of a publicly traded company's outstanding shares.
Market Cap = current price/share * number of shares outstanding
Private company headline valuations are similar to market cap, but can be much more deceiving depending on the level of “structure” (i.e. favorable terms for VCs) in the preferred stock.
Enterprise value (EV): is more comprehensive than market cap. EV includes the market cap of a company but also includes debt and any cash on the company's balance sheet. EV (not market cap) is used as the basis for financial ratios
EV = Market Cap + Debt - Cash
A lot of people get confused on the EV calculation… Why add money a company owes to its value and subtract their cash? Isn’t a company with more cash more valuable than one with less?
Enterprise value is a financing calculation and represents the amount you would theoretically need to pay to acquire a company. An acquirer would have to pay those who owns equity (shareholders) and everyone who has loaned it money (lenders). In other words, you get the company’s cash upon acquisition but need to pay off the debt. That’s why you add debt but subtract cash.
In reality, acquiring a public company outright will almost always be higher than the EV because their will be a large premium paid to be able to acquire all the shares.
Example: Imagine two companies with a market cap of $1B, but one of them has $1B of cash and the other has $0. The company with $1B is being valued from a market cap perspective just based on their cash level while the company with $0 of cash has built something worth $1B.
Stock Price Doesn’t Tell the Full Story
Zoom’s stock price might be basically flat over the past 4 years (since IPO), but does that mean valuation hasn’t changed? Not necessarily.
At the IPO 4 years ago Zoom’s EV was $15.7B and today it is $13B.
Wait…if you held the stock since IPO I thought you made 2%?
True. But Zoom’s cash position has changed significantly since the IPO. Immediately following the IPO, Zoom had $0.7B….And as of April 30, 2023, Zoom had $5.6B in cash and investments.
While the market cap went from $16.8B at the close of the IPO to $18.6B on May 24, 2023 (or 11% increase), the enterprise value actually decreased because of all the cash it has generated since the IPO is greater than the rise in market cap.
$18.6B market cap - $5.6B of cash = $13B EV
Hold up…now you are saying the market cap increased? How can the stock increase 2% but the market cap increase by 11%?
This is where dilution can kill investor returns and it mostly comes from every investor’s favorite topic lately — stock-based compensation (i.e. employee equity awards). Yes, the market cap is up, but the stock price did not rise at the same rate due to dilution (i.e. each share is now worth less because there are now more).
Below is the statement of stockholders’ equity for Zoom. This financial statement allows you to see the movement of outstanding shares. All of these lines relate to Zoom’s employee equity programs. And then in the most recent year there is a massive 11.2M share buyback (costing Zoom $1B) which is used to offset some of this dilution.
*This is why investors can’t ignore stock-based compensation as “non-cash”. It either hits the company as a cash outflow from stock repurchases or the dilution increases.
Zoom’s Valuation Roller Coaster
Here are some quick facts about Zoom at IPO:
IPO’d on April 18, 2019 and priced at $36/share
Shares closed at $62/share on the day of the IPO (72% above IPO price!)
Raised a net $542M from the IPO and its private placement
How has Zoom done since IPO?
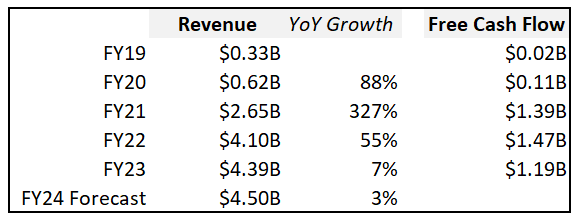
Current annual revenue is 14x higher than at IPO
Free cash flow grew 52x since the IPO with a free cash flow margins of 36% in FY23 (one of the highest of all public software companies)
At the peak, Zoom had an enterprise value of $160B! But then as quick as it rose, its valuation came crashing down right about where it started despite amazing execution over the 4 years and having significantly higher revenue and free cash flow.
Zoom’s Valuation Multiple Peers
In 2020 at the peak of Zoom’s valuation, it’s valuation multiple was in the top 10 with the likes of Snowflake, Bill.com, and Datadog.
Every company’s valuation multiple has significantly compressed since then, but Zoom’s compression is one of the highest. Zoom went from LTM (last 12 months) revenue multiple high of 109x to 3x today (or a 97% drop)!
Snowflake “only” went from 216x to 26x (or 88% drop)…
Why was Zoom’s valuation multiple crushed?
A lot of factors go into this, but it comes down to investor’s view on future potential and expectations.
If you layer on NTM growth expectations, you might conclude that it is one of the most expensive stocks given its very slow revenue growth expectations.
In the chart below by
, it takes the revenue multiple and divides it by NTM growth forecast. Zoom’s growth expectations in this data is 1%, so of course this multiple will look bad.I am fairly certain Zoom’s valuation would be higher today if the pandemic didn’t pull forward as much revenue as it did and revenue growth was more evenly spread through today. The end result can be the exact same, but how a company gets there can change a lot in future expectations.
Who are Zoom’s valuation multiple peers today?
Looking at software companies with a similar valuation multiple today is interesting because Zoom sticks out in a lot of ways.
Zoom has one of the highest free cash flow margins of any company with a somewhat similar multiple (and even when compared to all software companies). And in most cases its not even close.
It has the largest enterprise value of any company close to its valuation multiple. The only one even close is Splunk at an $18B EV and it has a 5x revenue multiple
Zoom has one of the lowest free cash flow multiples (EV/FCF) of any other software company — I believe top 3.
Concluding Thoughts
So is Zoom a buy? Sorry, but I don’t give stock recommendations.
Zoom has gone through a huge transformation in the past few years and has had some of the best SaaS metrics of any company. But now growth has basically halted after the enormous COVID pull forward and some folks concerns about Zoom’s ability to grow could be valid.
But the one thing I will say…I wouldn’t bet against someone as passionate as Eric Yuan (CEO/founder of Zoom).
*Disclaimer: This is not investment advice. The data above comes from various sources and could be inaccurate.


Re: EV...I’ve long struggled to understand why you take out cash but add back debt. Like I understood the formula academically, but not always in theory. Thanks for the clear explanation. You gotta pay people back you owe money
Amazing, well-thought out and well researched article. Thank you!