
Lies of Churn Rates & Customer Life
Do you have a viable business or are your unit economics broken because of churn?
Sponsor: Redefine planning with Abacum’s AI-native FP&A platform.

Built by former CFOs, Abacum understands the messy reality of leading finance at a scaling company. We built our FP&A platform to be the definitive single source of truth we always wished we had.
That same real-world experience is why we wrote this tactical guide covering everything from cash flow deep dives to GTM analysis. The Nuts and Bolts of Improving Your Business as a CFO cuts through the fluff to deliver practical analysis you can implement today, including a specific 60-day plan to prioritize your impact and build immediate value.
Download this must-have guide and start driving effective growth now.
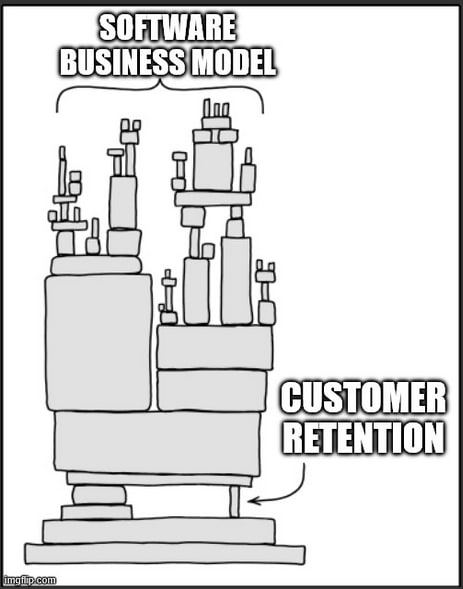
High Customer Retention or Bust
The entire software business model crumbles without high customer retention. It is what makes the math work for VC-backed software companies.
And guess what? Churn has already broken the unit economics of LOTS of software companies, but most don’t realize it yet. And many more will break as churn rises…
The software business model works because of RECURRING revenue (i.e. churn is low). The unit economics break if customers don’t stick around.
How it works:
Company invests a lot to acquire the customer (customer acquisition costs or “CAC”)
Customer stays for many years with little ongoing costs (lifetime value or “LTV”)
Company makes LOTS of money after breakeven point (CAC Payback)
The longer the customer lifespan the more profitable the company can become because of the low cost to continue to service the customer.
The key to the whole thing is high customer retention.
CAC Payback Period
Let’s start with the CAC Payback Period because it sets the floor for what the customer lifetime profit needs to be.
CAC Payback Period: how long it takes to recover the cost of acquiring a customer
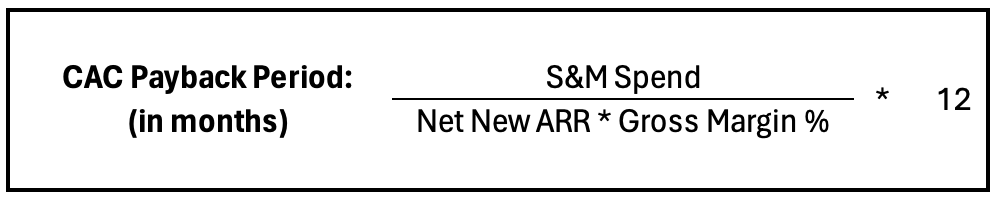
*Some people use prior quarter S&M spend (or something like that) to account for sales cycles length. That’s not today’s focus so I am just taking current S&M for simplicity.
In the example below, I take the quarter’s S&M expense and divide it by the quarter’s New ARR. You then have to multiply this by 12 to get the payback period in months. In the example below, the payback period is pretty steady around 25 months.
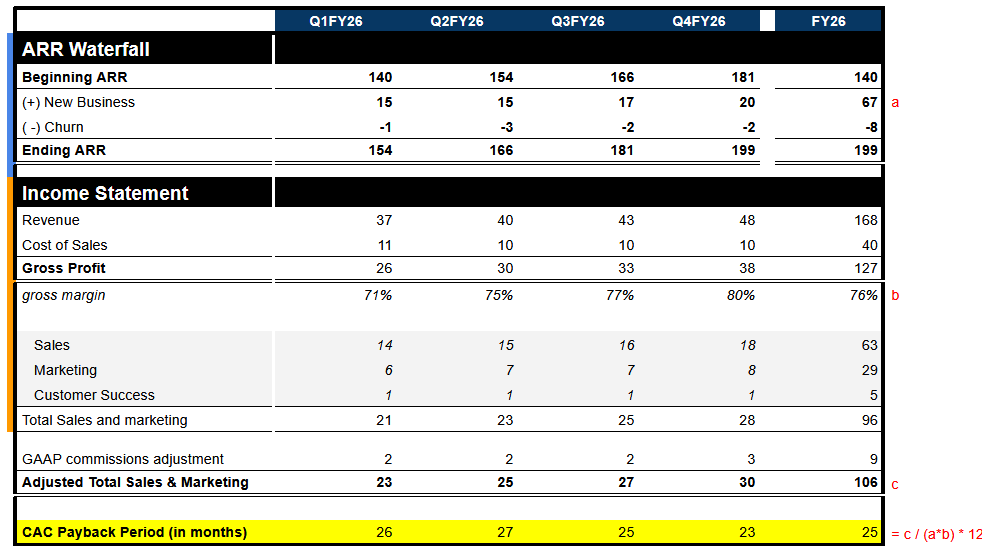
Two callouts in the payback period calculation to consider:
Commissions at software companies are often capitalized and amortized (usually over 3 -5 years) for GAAP purposes. Since commissions are a major part of CAC payback, I adjust this part of GAAP out so my calculation is taking the amount of commissions earned in period.
It assumes gross margins will remain the same throughout the payback period. For most software companies this has been a fairly safe assumption, but if you are expecting gross margins to materially change then factor that in. Maybe gross margins will fall as you introduce free AI features?
So this software company should be printing money on a per customer basis after ~2 years, right?
No. There are a couple of reasons for that:
CAC Payback Period only covers the initial customer acquisition costs. It doesn’t cover your R&D or G&A expenses. While those expenses don’t scale linearly with revenue, there must be enough total profits to cover those costs first.
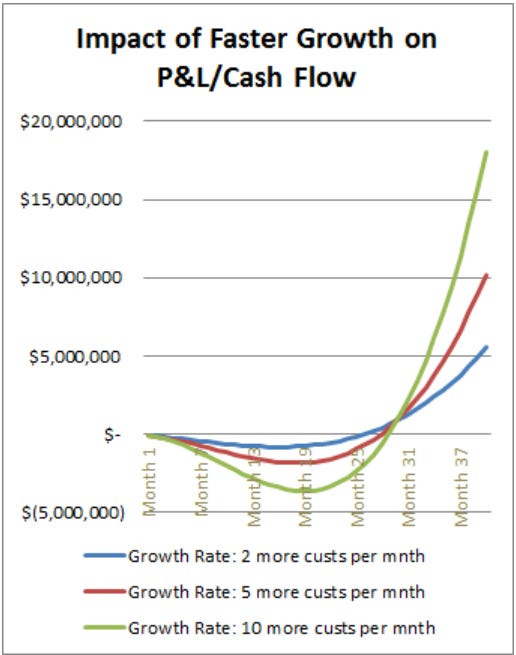
The faster the growth, the worse the free cash flow because of initial CAC investment. The CAC for most companies is greater than one year. So as long as the company is investing in higher revenue growth relative to the base of customers then cash flow will be negative. It’s only at scale when the base of customers is large enough and revenue growth is relatively small that software companies flip to being highly profitable.
A longer CAC Payback Period isn’t necessarily bad. As long as customers stick around for an even longer period of time.
CAC payback is a risk-based metric that doesn’t speak to how profitable customers will be. A short CAC Payback Period is bad if customers churn the next day. While a long CAC Payback Period is fine if customers stick around 5x longer than the payback period.
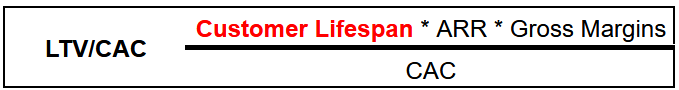
LTV/CAC is a Perfect Metric
LTV/CAC is a compound metric that uses just one more assumption than the CAC Payback Period.
But…this one assumption (customer lifespan) can make the metric very volatile. Small changes in customer lifespan can materially change the metric.
Companies tend to be incredibly optimistic and use generous definitions (often unintentionally) for how they calculate Customer Lifespan.
Is LTV/CAC not even worth looking at then?
The LTV/CAC ratio is theoretically a perfect metric that is very valuable. But it is ALWAYS wrong.
But…wrong doesn’t mean not valuable. Your annual plan is also always wrong, but you still go through that exercise, right?
The mental model, calculations, and discussions to determine the LTV/CAC ratio are valuable in my opinion. It tells you what must be true for you to have a viable business and how profitable your business can eventually become based on those assumptions.
How Do You Calculate “Customer Lifespan”?
The common method for calculating average customer lifespan is 1 / churn rate.
Example: If a company has an annual churn rate of 10% then you might conclude that the customer life is 10 years (1 / 0.1)
There are a few potential problems with this calculation that I will walk through in more detail:
How are we calculating the 10% churn rate? Is it the “right” way?
Are we oversimplifying churn behavior to extrapolate it to total lifespan?
Is past churn behavior a true indication of the future?
1. Calculating Customer Churn Rates
At a high-level, churn rate is the percentage of your customers that terminate their service over a given period.
Below are the two main churn rate calculations (logo basis or $ basis):

A common iteration to the above calculations is determining what those churn rates are on an “available-to-renew” (ATR) basis. Available-to-renew takes into consideration different contract lengths and attempts to give an indication of how likely a customer is to churn assuming they have the ability to churn (i.e. contract is up for renewal)
Available-to-renew example: If a company has 100 customers at the beginning of the period and 10 of them churn, then under the simple churn rate calculation they have a 10% churn rate (or 90% retention rate).
But what if only 60 customers were available to renew because the other 40 signed multi-year contracts?
In this case, the available-to-renew churn rate is 16.7% (or 83.3% retention rate)
People often mistakenly assume that the ATR churn rate is somehow more real. It is an interesting data point, but there is a duration mismatch so comparing these churn rates with different contract lengths doesn’t make sense.
2. Errors in Churn Extrapolation
Unless a company has a long history of churn, they don’t really know if there will be large stair steps of churn over a cohort’s customer life.
Example:
Let’s say in the early days the company did an amazing job selling to their target customer. For the first 3 years of business, the annual customer churn is only 5%.
Does this 5% churn mean that on average customers will stay for 20 years (1/0.05)?
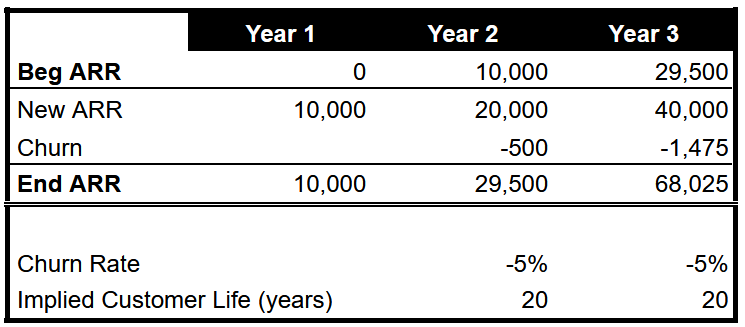
Likely not….the length of churn history is inadequate to capture what happens to that original cohort of customers. What if after the original 3 years there is a stair step in churn as a lot of customers become more complex and outgrow the tool? Maybe the tool focuses on SMB and customers typically outgrow their tool after 3 years…
Then churn will increase a lot in year 4.
Churn Cohort Analysis
Continuing the example above, the large increase in churn in year 4 could misrepresent “customer lifespan” if you only look at simple total churn rates.
As seen below, yearly churn is 5% for the first couple of years, but then churn explodes to 18% on a simple total basis (churn $ in year 4 / ARR at the beginning of the year).
What this analysis fails to capture is that most of the year 4 churn is due to the year 1 cohort of customers. And now ALL of the year 1 customers have churned. High growth in year 4 is hiding the problem.
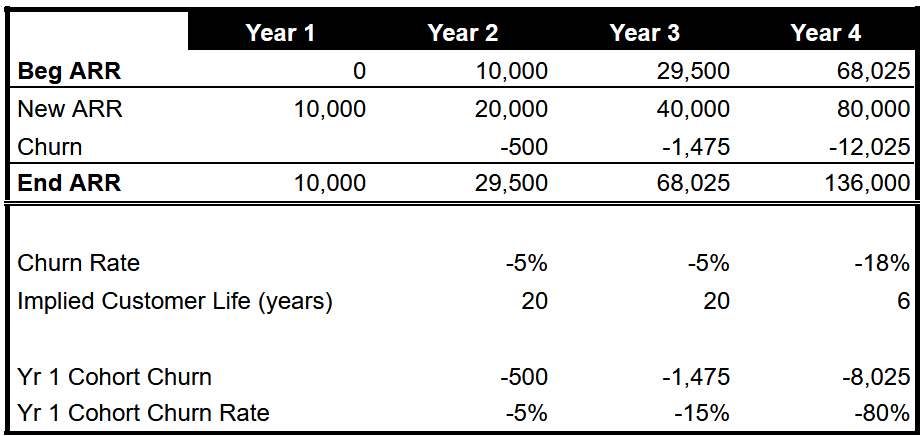
So what is the customer lifespan?
For the first 3 years we assumed we had a 20-year customer life, but now in year 4 the same calculation shows we have a customer lifespan of 6 years. That’s a 70% reduction in the metric (20 to 6 years)!
But a 6 year customer life is still pretty good, right?
Maybe. But 6 years is still wrong…
We just said that all year 1 new customers churned by the end of year 4 🤔, so doesn’t the average customer life have to be less than 4 years?
You are almost doubling the “customer lifespan” by looking only at a simple total churn rate!
Looking at churn rates on a total basis can be misleading, especially when high growth is softening the simple churn calculation. Looking at customer cohorts will help capture any potential stair steps of churn as long as you have enough historical data.
3. Technology Changes May Make Historical Churn Rates Useless
In the early days of Salesforce, a customer life expectation of 15 years with little ongoing customer cost made sense. Competition was light and building something like Salesforce was extremely hard.
That is NOT the case today.
There are tons of competitors in every single space today. And their software is good! AI is making the competition fierce.
Historical benchmarks of retention/churn are likely not the best indicator for the next 10 years.
Final Thoughts
I don’t think the vast majority of companies should regularly report LTV/CAC. Companies are not good at forecasting “customer lifespan” so the metric becomes kind of meaningless and it jumps around a lot each quarter.
Here’s what I do think you should do:
Regularly calculate and present CAC Payback Period. It’s easy to calculate and only has one assumption (gross margin) which typically doesn’t vary that much. Also, it shows the floor for what customer lifespan must be.
Companies should *occasionally* discuss LTV/CAC with customer lifespan being the major discussion point after they have some revenue scale.
The occasional discussions around Customer Lifespan are helpful because they can potentially reveal longer term issues that need to be fixed now before unit economics break.
Footnotes:
Download this guide (from Abacum) to partner better across departments.
Check out OnlyLawyer for the legal version of OnlyCFO. Subscribe if you own the legal dept and/or send it to your legal friends.
The spreadsheets reveal the leak, but in my experience what fixes the unit economics is when you nail the first 90 days with your customers.