
Math to Evaluate Sales Reps & GTM
How I triangulate GTM and sales rep efficiency
Brought to you by Brex, the modern finance platform.

Tired of choosing between tighter spend controls and faster execution? With Brex, you can break the tradeoff. Get the smartest corporate cards, banking, expense management, and travel — all in one place. You’ll save money and automate busywork while your competition is still reconciling last month's expenses. See why 30,000+ companies spend smarter and move faster with Brex.
GTM efficiency has hit record lows at many companies so I wanted to cover two topics in this post:
How to properly evaluate GTM efficiency
How I evaluate sales rep performance (and the reports I use)
As I discussed in my last post, overall company financial metrics can be misleading since they are typically lagging metrics. You MUST understand your current unit economics.
The math I walk through below helps you triangulate your true unit economics and helps you make better decisions.
GTM & Rep Efficiency
Below are 4 things to review when evaluating sales rep and overall GTM efficiency. These are in addition to more general metrics like the CAC ratio and CAC payback period that I covered in the last post.
1. Quota : OTE Ratio
Standard advice is that a good quota:OTE ratio should be somewhere around 4 - 6x. In other words, AEs bring in 4-6x their total compensation in ARR.
The report below from ICONIQ shows benchmarks from their portfolio companies broken down by rep segment. Note - ICONIQ has some of the best companies so their ratios will be higher than most.
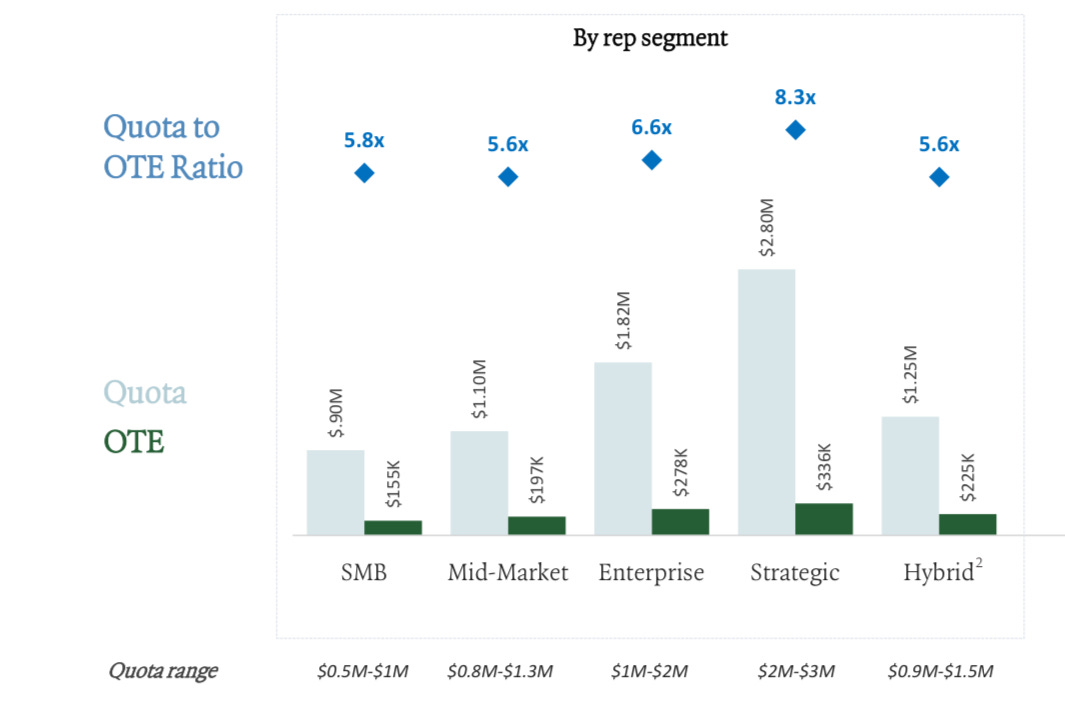
Smaller companies typically have a relatively smaller quota:OTE ratio and as companies mature this ratio expands as the sales process becomes easier - brand is built, referrals are plenty, etc.
Having a good quota:OTE ratio is awesome but it means nothing if attainment is low. You need to also review actual attainment vs OTE.
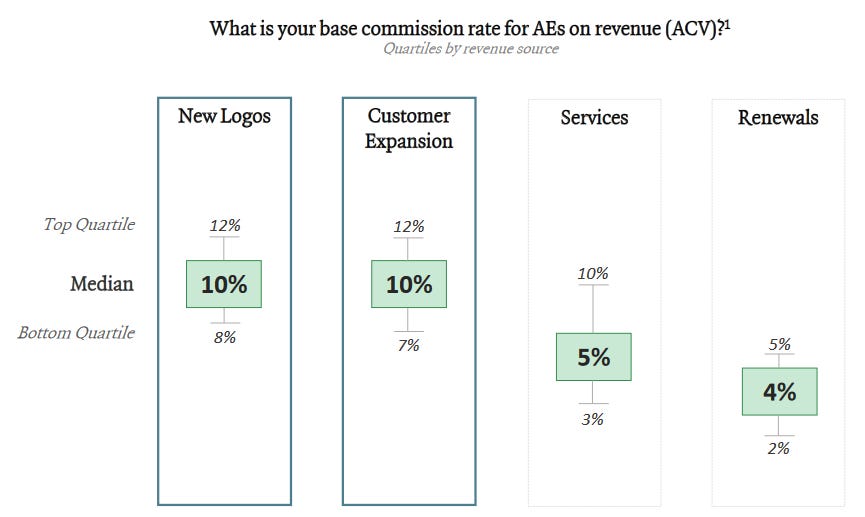
2. Commission Rates
A similar way to look at rep compensation is just the actual commission rates - for every $1 of revenue brought in how much are we paying sales reps?
The benchmarks below align with my experience, but similar to above, MANY companies are higher than this range as well (which is bad).
3. Sales Rep OTE
OTE = “on target earnings” which is a fancy way of saying what a sales rep would earn if they hit their targets at 100% (includes base salary + commission)
The best sales reps should be the company’s highest earners (on a cash basis). This does not mean all sales reps should be crushing their quota and making massive amounts of money…otherwise the big efficiency that should come from best reps beating quota is lost on overpaying the poor reps.
The graphic below from ICONIQ shows the standard split of base/variable and the OTE by stage and segment.
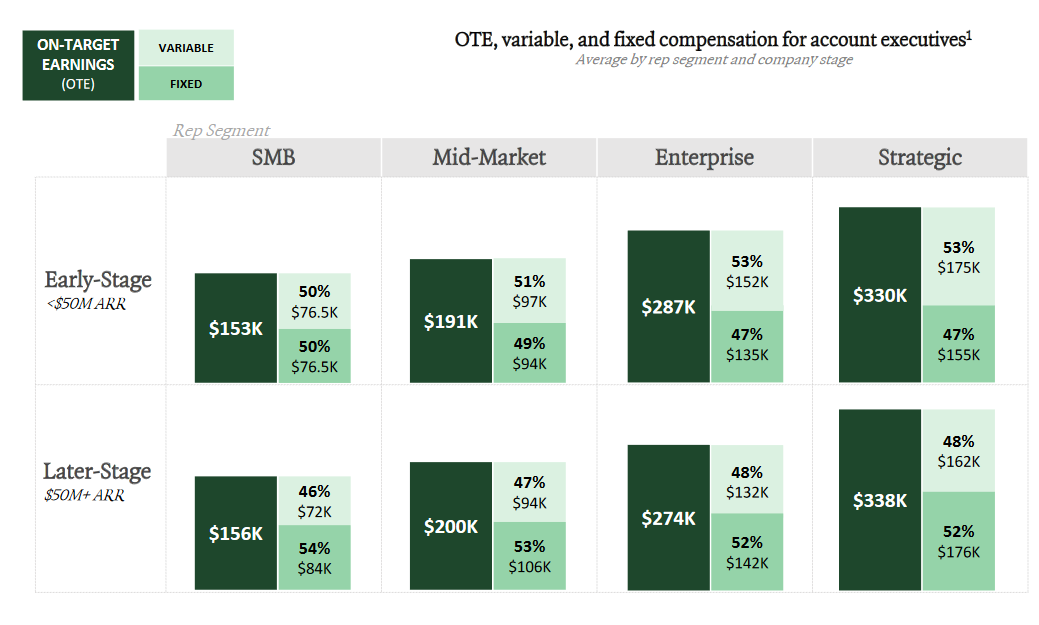
I know many companies that pay their reps like they are Enterprise reps, but actually they have SMB or mid-market quotas and deals. Make sure sales rep compensation and job titles reflect their actual work - otherwise you will pay too much.
4. The GTM Pod
Metrics in isolation are dangerous—context matters!
The previous triangulation of sales efficiency can be interesting when reviewed against current benchmarks, but they mean nothing if the entire GTM Pod’s efficiency isn’t also evaluated. This is where many folks fail to understand their true unit economics.
A GTM pod is all the headcount and spend that surrounds an individual Account Executive (AE).
I have talked with many founders that believe their sales efficiency is amazing because they have a 6x Quota:OTE ratio but find out later their “GTM Pod” is crazy inefficient because of bad economics from supporting roles/spend around the sales rep.
Here is a model I created to show GTM Pod efficiency that you can play with.
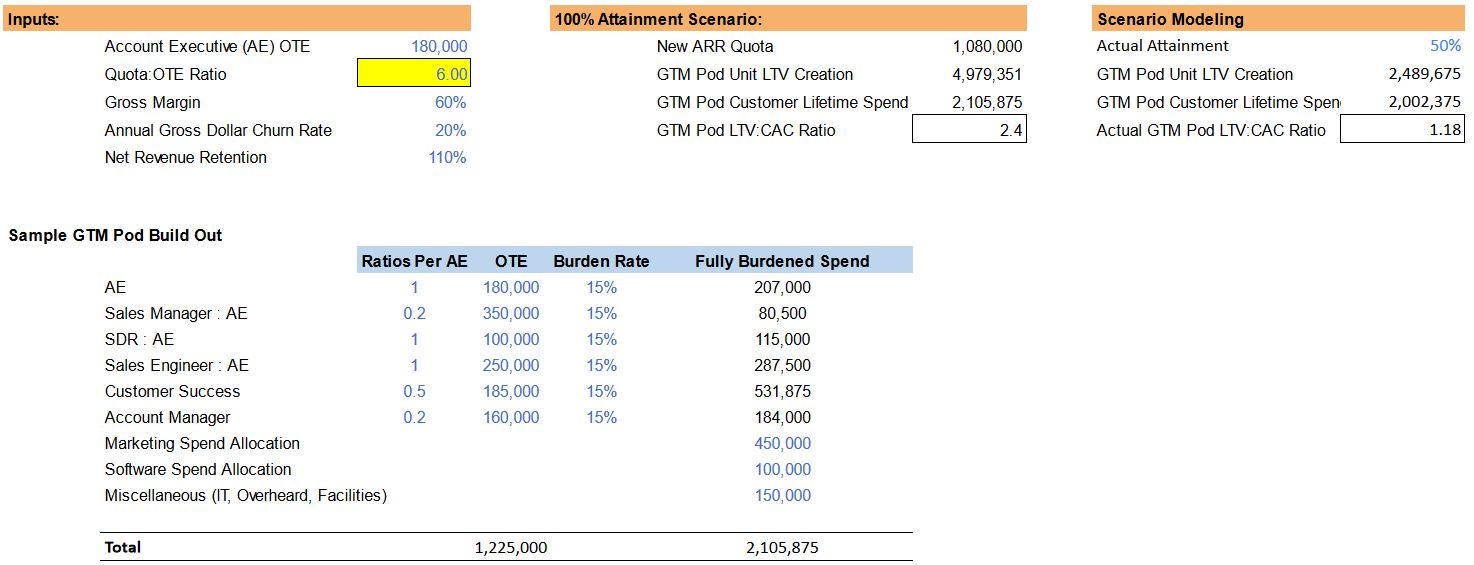
You NEED to analyze GTM teams at the atomic unit (GTM Pod) required to sell because it really shines a light on the true total GTM efficiency.
Evaluating Sales Reps
Over the next year the separation between the best sales reps and everyone else (mediocre and bad reps) will grow REALLY wide.
AI will amplify the impact of the best reps
Cost cutting will require management to cut the low performers faster
High performing reps might be paid a lot but they are MUCH less expensive than the bad reps.
Here are some key reports I make sure my CRO is reviewing to evaluate individual sales reps so we can get the more expensive reps (the bad ones) out faster:
Attainment - how are they doing against quota and peers?
Weighted discounting by sales rep - are they discounting a lot to get deals done? This shrinks gross margins…Bad reps overuse discounting.
Pipeline coverage - do reps have sufficient pipeline to hit targets?
Pipeline source, self-generated vs other sources - are reps building their own pipeline? Especially if they don’t have sufficient pipeline
Stage conversion rates - are reps converting at expected rates (and compared to peers)?
Time to close - are reps taking too long to close deals? Or are they holding on to dead deals way too long to look busy?
Oppties per rep - how many deals are the rep working? Are they even busy?
New logo vs expansion - are reps living off of easy expansion or are they closing new stuff
Final Thoughts
Your sales capacity model may say you need a certain amount of reps to hit your revenue growth targets, but….hiring to an unachievable growth target is a great way to enter a death spiral - too many sales reps chasing too few deals, best reps leave, deals are lost, CRO is blamed and is fired, etc…
Make sure your unit economics make sense and that your GTM model can actually be efficient. Lots of GTM models will break in the world of AI so be quick to adjust — costs NEED to come down so the potential LTV:CAC ratio makes sense.
Figure out what reps are performing poorly, get rid of them, and get better ones.
Footnotes:
Check out Brex’s guide on how to automate busywork.
Join the next OnlyCFO Webinar on how the definition of ARR is change and how you should adapt. You won’t want to miss it!

Check out OnlyExperts to find offshore accounting resources. They have some amazing talent for 20% the cost of a U.S. hire
Great discussion. Not a topic I'm very familiar with, so appreciate the context.