
AppFolio - If you invested $1,000 at IPO...
Lessons from one of the least sexy software companies in the world
If you had invested $1,000 at the AppFolio IPO in 2015 you would have $18,000 today! That’s a CAGR of ~40% over nearly 9 years 🤯
With the clickbait out of the way…this post covers lessons from AppFolio and how one of the most boring public software companies has managed to have some of the best metrics amongst public software companies. These are lessons both operators and investors should understand.
But first a word from our sponsor...
Today’s Sponsor
Check out Vertice’s post for actionable tips for optimizing cloud and SaaS spend. It has lots of great questions and tips for cutting software waste.
Vertice recently raised a Series B for its solution built for finance teams to get granular control and visibility of their SaaS and cloud spend.
What is AppFolio?
Most people know very little about AppFolio because it operates in a rather boring and not sexy industry — property management software. AppFolio is a vertical software company that helps property managers manage their real estate units.
Limited opportunity, right? Wrong…they are a $8B company and approaching $1B in ARR 🤯
As I have said before, there are riches in the niches!
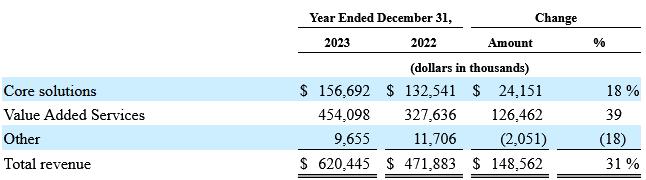
It’s worth noting though that AppFolio is not pure software. A significant portion of revenue comes from payment services, tenant screening services, and risk mitigation services (value added services). Most of 2023 growth actually came from non-software revenue.
Stock Performance
AppFolio is included in a rare group of software companies that are 10-baggers (an investment that returns 10x) since its IPO.

Another time horizon I like to look at is stock performance since peak software stock bubble (which I am calling November 2021). Of the ~80 software companies I am tracking only 10 have seen a positive share price movement and AppFolio comes in at a strong #2!

AppFolio Metrics
Rule of X
In my previous post I covered the Rule of X in detail, so refer to that if you need a refresher. The below chart shows the most improved Rule of X scores between 2021 (when software companies were firing on all cylinders) and today based on current estimates for 2024.
AppFolio is at #2 for most improved.
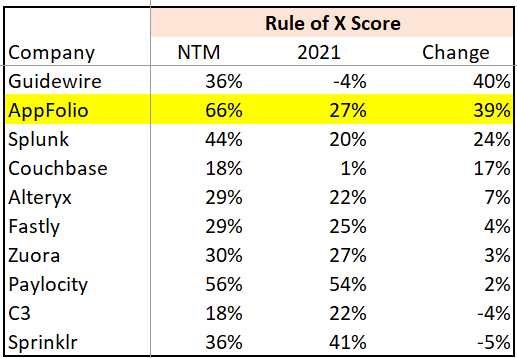
The reason most of these companies Rule of X score improved more than all the others is because they had relatively slower growth in 2021 so when applying a 2x multiplier to revenue growth these companies were impacted less.
But AppFolio is more unique than the other companies on this list as the below metrics will show…
Revenue Growth & Endurance
AppFolio is one of the few companies (less than 5 I think) that have reaccelerated revenue since 2021. AppFolio increased revenue growth from 16% in 2021 to 31% in 2023. As you can see below, AppFolio reaccelerated revenue in 3 different years.
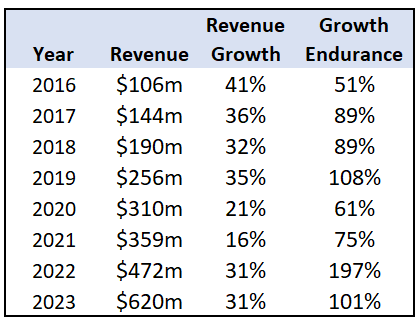
AppFolio has one of the strongest revenue growth endurances I have ever seen.
Growth Endurance = current year growth rate / last year growth rate
While AppFolio hasn’t seen periods of crazy high revenue growth like many other software companies, they have had really solid revenue growth for a really long time. In 2016 they were growing 41% and after 7 years they are still growing at 31%.
Strong revenue growth endurance has an exponential impact on value. One-time very strong revenue growth followed by weak growth doesn’t provide enough time for significant compounding — see my previous article on Zoom’s growth.
Stock-Based Compensation (SBC)
SBC expense is often a hot topic because so many investors have ignored it and so many companies have abused it (i.e. given out way too much equity and dilution investors).
Shorthand valuation metrics, like the Rule of X (or Rule of 40), completely ignore the impact of SBC. But…the impact of SBC can have huge shareholder consequences.
The core issue with SBC is that it dilutes shareholders — if you own 10% of the company and there is subsequently 10% dilution, then now you only own 9%. SBC and the related dilution isn’t necessarily bad, but it needs to be appropriate relative to company growth. SBC is required to hire the best talent — I don’t know of a software company that doesn’t give equity as part of the comp package.
The below image shows the run-rate dilution for public tech companies. Looking at the software bucket, the average annual dilution is 3.2%.
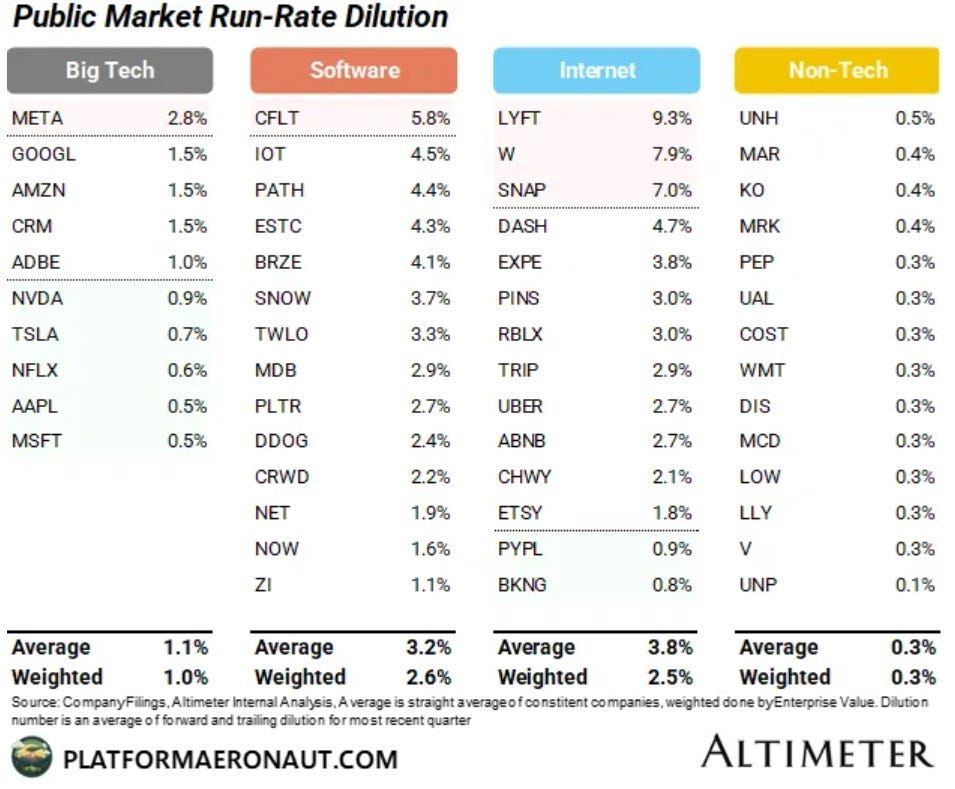
Meanwhile, AppFolio’s average annual dilution over the past 5 years is only 1.1%! Over a 5 year time horizon that difference is huge.
The below chart shows the difference between 3.2% dilution and 1.1% dilution to an investment over a 5 year time horizon assuming the value of the company stays flat.
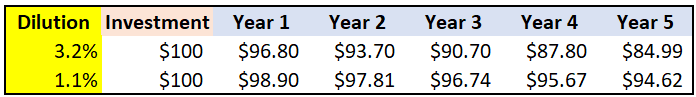
AppFolio at a 1.1% dilution rate will have a MUCH easier time providing a positive investor return because less revenue growth and profit improvements is required to make up for the dilution. In the example above, a $100 investment turns into $85 at 3.2% dilution versus $95 at 1.1% dilution assuming no valuation increase.
SBC vs Dilution
A lot of people use SBC expense and dilution interchangeably, but they can be quite different. SBC expense is an accounting rule that requires recording an expense on the income statement that reflects the fair value of equity awards provided to employees. The accounting rules are complex so I won’t cover it in detail here, but just know that using SBC expense as a proxy for dilution doesn’t always work well. If you are interested for more detail check out my previous post on SBC.
Having said that, the below chart shows the public software companies with the lowest SBC expense as a % of revenue. AppFolio comes in at the 8th lowest (i.e. best) SBC as a percentage of revenue out of 80 companies. It is worth noting that AppFolio clearly has the fastest revenue growth out of all of these companies.

Another interesting view of SBC is comparing SBC percentages for the companies with the highest Rule of X scores. AppFolio comes in with the 13th highest Rule of X score but with an SBC percentage far below any of these other companies.
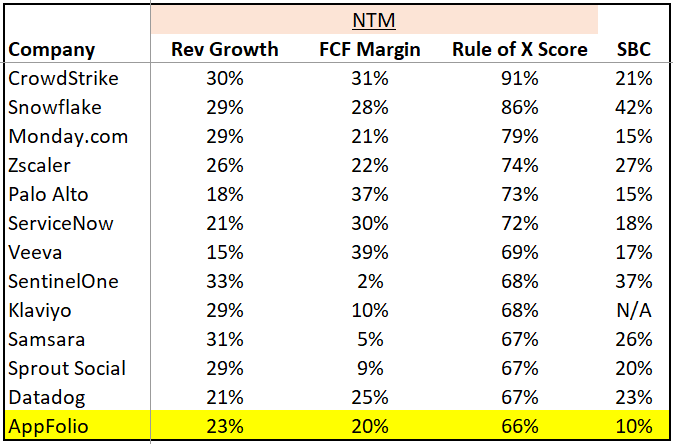
The Rule of X makes no consideration for SBC/dilution, so while AppFolio’s Rule of X score might be lower than the rest of these companies, investors may have an easier time generating returns with AppFolio given it will be less of an uphill battle as a result of less dilution.
Final Thoughts
Don’t ignore the non-sexy, boring software companies. AppFolio has had really good revenue growth for many years and they have felt the impact of compounding revenue growth over the past decade. Their revenue growth hasn’t really been top quartile, but it has remained really good for a long period of time.
While they haven’t always been the most efficient, AppFolio has taken free cash flow (FCF) from 1% in 2022 to 12% in 2023 and are forecasting 17% in 2024. That is some rapid improvement in efficiency, especially when considering they will plan to grow 23% in 2024.
The companies that have strong durable revenue growth, are efficient, and have low dilution often can provide better returns than the hot companies with a short burst of inefficient revenue growth and high dilution.
Footnotes
Check out our sponsor’s tips for optimizing cloud spend.
Sponsor OnlyCFO Newsletter and reach 16k+ CFOs, CEO, and other leaders in the software industry.
Reply to this email with any questions or feedback
If you are a Substack writer, please recommend my newsletter!
*Certain metric data was sourced from cloudedjudgement.substack.com
Excellent insights regarding AppFolio and SBC. I invested in AppFolio 4 1/2 years ago (unfortunately, long after the IPO) and have had a 104% total return over the period of a few ups and downs.
Hi OnlyCFO - thanks for your post. I am curious how one calculates dilution and where do you see that number going for Appfolio over the next 5 years? I believe you had dilution at 1.1% for Appfolio as of the date of this post.