
The Ultimate Income Statement Guide
The P&L guide for your teams in preparation for annual planning. Accounting is the language of business so everyone needs to understand it.
Today’s sponsor: Brex, the intelligent finance platform.

CFOs are building for 10 scenarios, not one.
Can resilience be a strategy? Brex CFO survey data says it is now. Tariffs, AI, and global uncertainty have made stability a moving target and adaptability the next big edge. But 69% say their finance stacks are too complex to move fast, and 75% feel pressure to accelerate AI results. See how CFOs are making flexibility, automation, and speed their new KPIs.
Financial Illiteracy Destroys Company Value
CFOs are entering the thick of annual planning for 2026. Annual planning is one of the most important jobs of the CFO to properly allocate resources in pursuit of maximizing company value (balancing growth with profitability).
Want to know what one of the biggest problems with annual planning at almost every company?
A lack of financial literacy among leaders/employees. This creates a massive misalignment between the CFO and the rest of the company. The rest of the company can’t be fully bought into the plan if they don’t understand financials…
Share this guide with your company to get folks aligned!
Understanding Financial Statements
There are three primary financial statements:
Income Statement
Balance Sheet
Statement of Cash Flows
The focus of this post is the Income Statement (aka P&L, Statement of Operations, etc). The other two financial statements are important, but it is critical that EVERYONE (especially leaders) understands the P&L for annual planning.
Even some finance folks don’t understand some of the nuances here…
Income Statement
The income statement is a window into the performance of a company over a specific period of time by reporting on a company’s revenue and expenses.
The period of time included in the income statement snapshot is almost always one year or less (typically annual, quarterly, monthly, or year-to-date). Each of those individual snapshots should be reviewed with the historical comparative periods for context. The historical context is key to seeing the trends in the P&L.
Below is a typical software income statement. The rest of this post will break down each line with what is in it and why you should care.
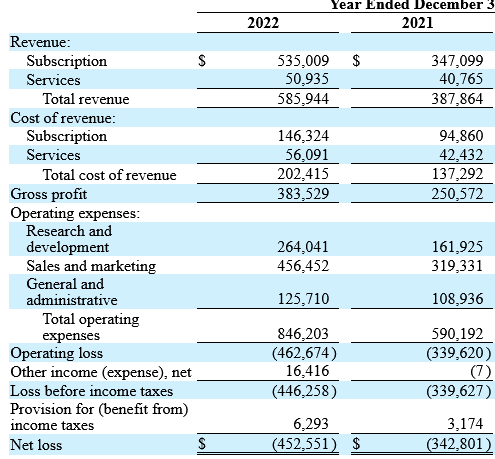
1. Revenue
Cloud/AI companies have two primary categories of revenue:
Cloud/AI revenue
Seat-based
Usage-based
Flat fee
Professional services & other
Implementation services
Advisory services
Managed services (some will include this in a recurring revenue line tho…)
Cloud/AI revenue is the “good revenue”. It’s the type that investors care about and what will hopefully make your company very profitable. Professional services revenue is generally neutral, but too much and it might be bad because investors assume you run a professional services shop instead of software that can really scale fast.
When professional services revenue is immaterial, then many companies will just show one line called “revenue” on their financials. However, for internal management reporting all major revenue categories should be broken out so each revenue type can be reviewed separately.
What is “revenue”?
Revenue reported on financials is known as “GAAP” (generally accepted accounting principles) revenue.
GAAP Revenue: revenue is recognized as services are delivered
Seat-based or flat fee pricing: Revenue recognized evenly over the contract term.
Usage-based pricing: As the service is consumed. Which means more volatile revenue.
Professional services: As the services are delivered
There are LOTS of accounting nuances where revenue is recognized differently than above, but these rules are generally true.
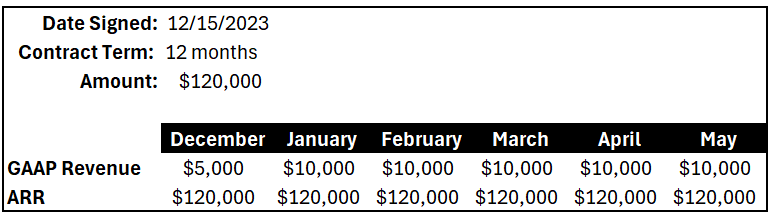
GAAP revenue reported on financials is a lagging metric compared to ARR (annual recurring revenue). ARR is a point in time total recurring revenue metric while GAAP revenue represents the amount recognized for the period being reviewed.
Example:
If a company closes a $120K software deal on 12/15/2023 then they would show $120K new ARR starting on that day. But they would only show revenue of $5K. Formula: $120K / 12 months = $10K per month and only half of December should be recognized as revenue.
There are a lot of “revenue” numbers people may refer to, but revenue on the financials is ALWAYS GAAP revenue. Make sure you know what people are referring to when they talk about revenue!
2. Cost of Revenue (aka COGS)
Cost of revenue should be broken out the same way that revenue is broken out:
Cost of revenue - cloud/AI
Cost of revenue - professional services and other
And similar to revenue, if you have multiple types of revenue underneath each of the above (e.g. usage-based) then you should break that out at least for internal purposes/tracking.
Cost of Revenue - Cloud
The major categories that are included here are:
AI-related costs — LLM inference, training, model hosting, 3rd-party API costs, customer model training, user prompting, licensing fees for training, etc
Infrastructure costs - AWS, GCP, Azure
Support team - responding to customer support tickets
DevOps - people ensuring uptime and reliability of customer accounts
Customer success management (maybe) - see my prior post on how to categorize
Software and other costs for the teams above
Cost of Revenue - Professional Services & Other
Professional services COGS is pretty straightforward:
People costs for delivering the services
Software and other people-related costs to deliver the services
Costs of any other revenue generated
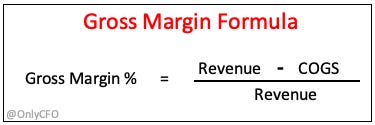
3. Gross Margins
Gross margins tell you how much profit (as a % of revenue) you have after subtracting COGS from revenue. Viewing it as a percentage of revenue is more useful because then it is comparable to other companies.
COGS is a *very* protected expense category because software/AI company valuations can be highly correlated with gross margins.
CFOs will fight any increase in COGS harder than any other expense line. If this is your budget…it will be HIGHLY scrutinized.
The reason investors care so much about gross margins is because COGS grows very linearly with revenue while operating expenses are not variable and *should* have a lot more leverage at scale (see below on what operating expenses are). Gross margin is the incremental cost of delivering more of the software solution.
Example: A company with 75% gross margins may only be able to improve gross margins to 78% after doubling revenue because of more efficiencies at scale, but it can cut its operating expenses by 30% over the same period of time. This is because COGS (and related gross margins) are direct costs of delivering the cloud solution that move in line with each additional dollar of revenue.
You should separate gross margins by revenue type (and at least gross margin profile):
AI Gross Margins: Many super-growth AI company gross margins are really low (or even negative). They are relying on AI COGS to continue to drop so that their gross margins can eventually look like typical cloud companies of 75%+. See my AI gross margin post here
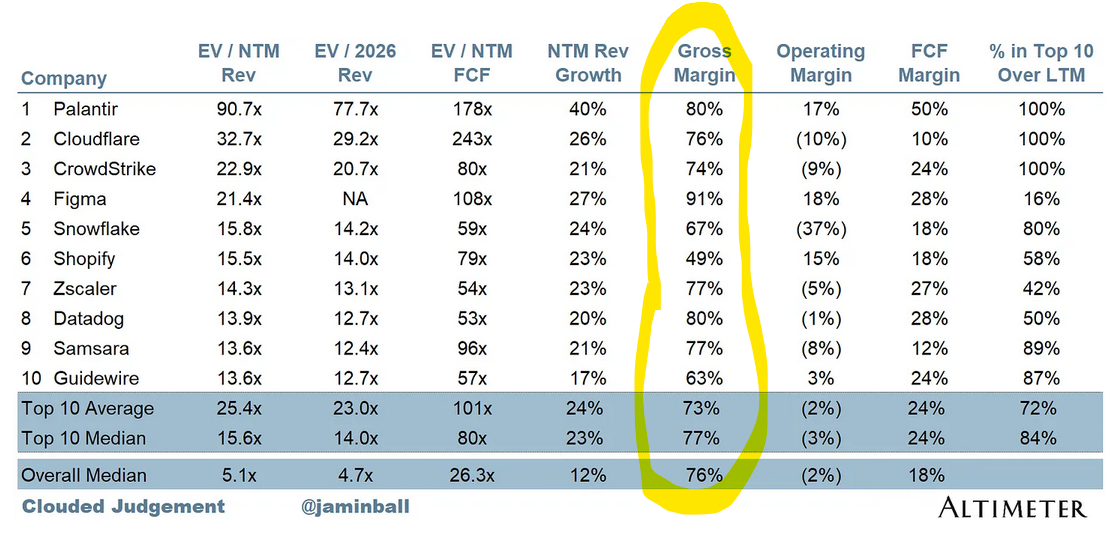
Typical Software Gross Margins: True cloud revenue should have really high gross margins. The top 10 cloud companies with the highest valuation premiums have an average gross margin of 77%. Lower gross margin companies will have a lower valuation premium, all else being equal.
Professional Services Gross Margins: A lot of companies run their professional services part of the business at breakeven (or even a loss) because they rely on the software revenue to generate all the profits and the professional services is just there to help sell more software.
4. Operating Expenses (aka “OpEx”)
The operating expense section of a company’s income statement almost always has the following categories:
Sales and marketing (S&M)
Research and development (R&D)
General & administrative (G&A)
For internal purposes these categories are often further broken up, but for external financial reporting these are the categories.
What is included in each category?
Sales and marketing (S&M)
Sales team payroll (AE, SDR, SEs, sales management, etc)
Marketing payroll (demand gen, PR, events, comms, etc)
Customer success payroll (see COGS section on debate between COGS and S&M)
Rev ops and sales enablement
Software and other non-headcount costs for these teams
Hosting costs for trials (such as AWS)
Research and development (R&D)
Engineering, product, and design payroll-related costs
Software and other non-headcount costs for these teams
Dev infrastructure costs (such as AWS)
Note - many earlier-stage companies don’t break these costs out properly between COGS, R&D, and S&M
Quality assurance (QA)
General & administrative (G&A)
Finance, legal, HR, and other executive payroll-related costs
Corporate insurance
Financial audits
Other administrative costs
OpEx Benchmarks
Below is a good graph from ICONIQ on OpEx as a % of revenue at different revenue scales. While these are good…remember that AI is quickly screwing up benchmarks and benchmarks will change!

5. Other OpEx Items
Allocated Departments
There are certain expenses and teams that should be allocated across all of the above expense groups (COGS, R&D, S&M, and G&A) based on relative headcount or some other reasonable allocation methodology.
IT: People and software the entire company uses
Recruiting: Internal recruiting resources (sometimes this is put into G&A though)
General: Facilities, company offsites, etc
Understand how these are coded versus other companies so proper comparisons can be made.
Many earlier stage (and some later stage…) companies use G&A as a dumping ground of costs and erroneously put way too much expense in G&A. If G&A costs are way higher than benchmarks, then you likely have an expense-dumping ground problem.
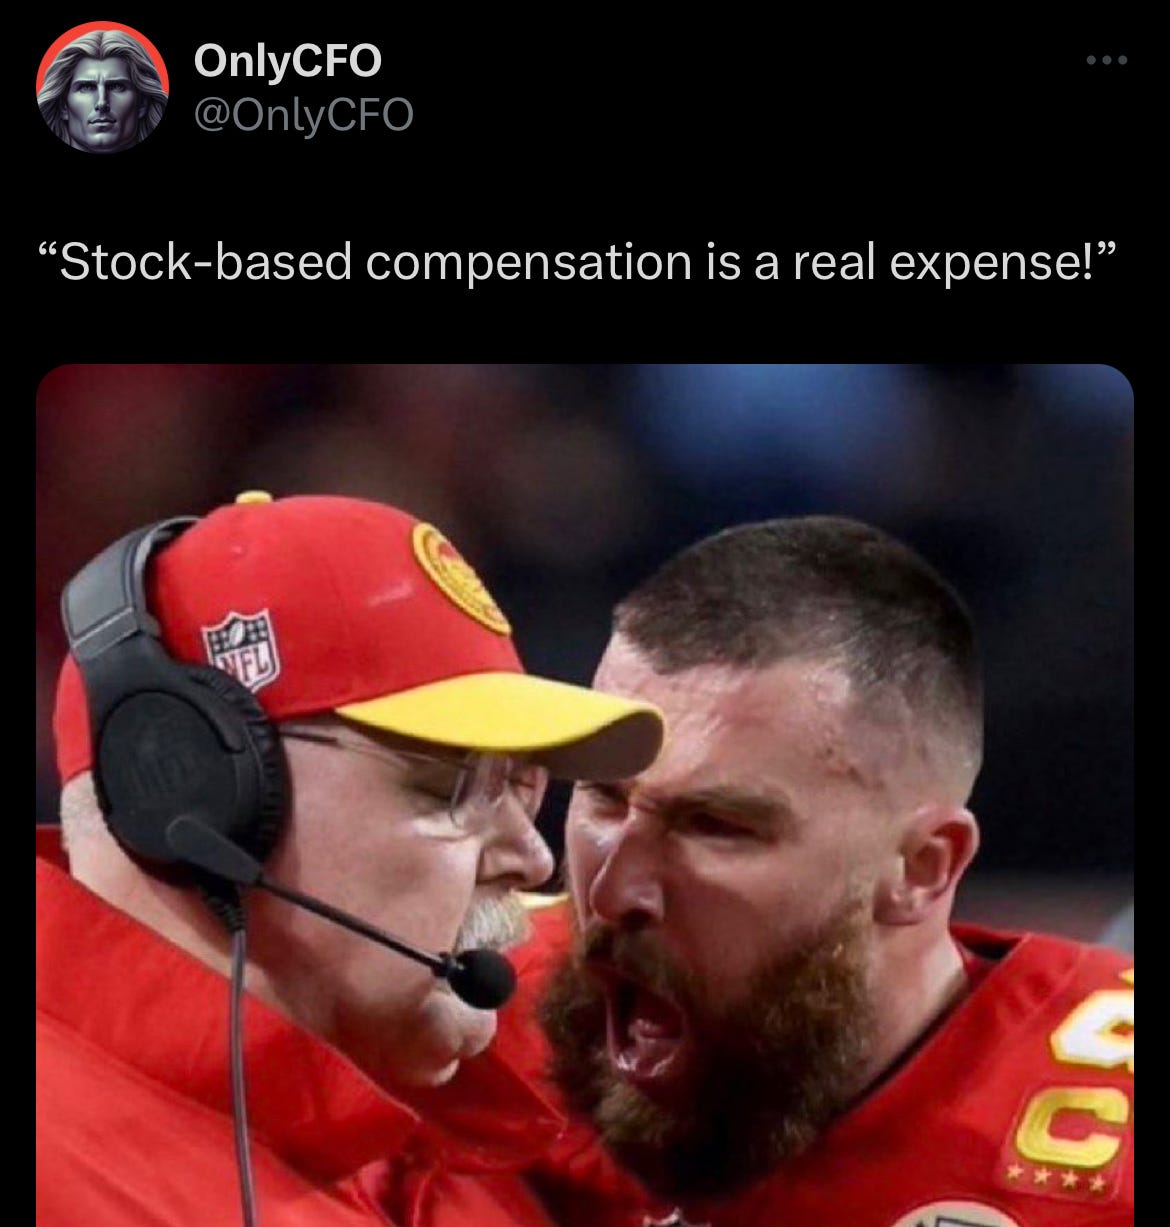
Stock-Based Compensation (SBC)
Most people don’t really know how to think about SBC’s impact, especially in the private markets. Check out my previous post for a SBC deep dive. The short version is that SBC is a real expense and should NOT be ignored…
Here are the basics that you should know about SBC:
SBC represents all equity-based awards (e.g. stock options, RSUs, etc) that are given to employees, consultants, advisors, etc.
Accounting rules require companies to record an expense on the income statement that represents the fair value of these equity-based awards. The expense is recognized on the income statement over the period the award is earned (typically over 4 years).
SBC expense is a non-cash expense because the company doesn’t pay cash when issuing the award. The real impact is that there is more dilution to shareholders because more awards are issued….this is why it should not be ignored.
Sales Commissions
The majority of sales commissions for software companies are NOT expensed on the income statement when earned. Accounting rules require that it gets expensed over several years. Most software companies expense sales commissions over 3 - 5 years.
Example: A sales rep closed a deal on 12/15/2023 and earned a $12K commission that was paid on the day the deal closed. Even though there was a $12K cash payment to the sales rep in December, only $333 (1/36th of the commission) is expensed on the income statement. That same amount will be expensed over the next 3 years.

Pay attention to this as you try to understand the unit economics of the business because it will screw up your financial metric calculations unless you unwind it. I always add the full amount of commissions earned (rather than GAAP expense) for metric calculations. If your GL is set up properly then this is easy to do.
6. Other income (expense)
Other stuff that most people other than finance and the CEO don’t need to worry about:
Interest expense and income
Foreign exchange gains and losses
Investment gains and losses
7. Income Tax Expense
Eventually, software companies have to become profitable, but even before that point they might have to deal with income taxes:
Foreign entities: If a company has set up foreign entities, then income taxes might be owed in these foreign jurisdictions even if the consolidated company isn’t profitable.
Financial net income doesn’t equal taxable income: Tax net income may be different than financial net income because of lots of accounting and tax differences (too boring to explain and most of you don’t need to know it)
Concluding Thoughts
The best way to make sure the entire company is aligned for 2026 annual planning is to make sure folks understand the P&L:
Where are the expenses going?
What is important to my company?
What are the levers we have?
What does great look like?
Below is a quick summary of the P&L components. Staple it to your fridge!

Footnotes:
Download this CFO survey data on top concerns and priorities in 2025 (from Brex)
Check out OnlyLawyer (cousin to OnlyCFO) for all things legal for tech companies
I have run tech and engineer heavy organizations, and I like to point out that the income statement is the derivative of the balance sheet, which helps get our heads around the more odd elements to revenues, even if not considered ordinary income. It also helps explain SBC, since you keep track of the capital account on the balance sheet. This is for wonks, of course.